Figure 1 - Effect of Arctic amplification on temperature rises above the Paris limits in CMIP6 models
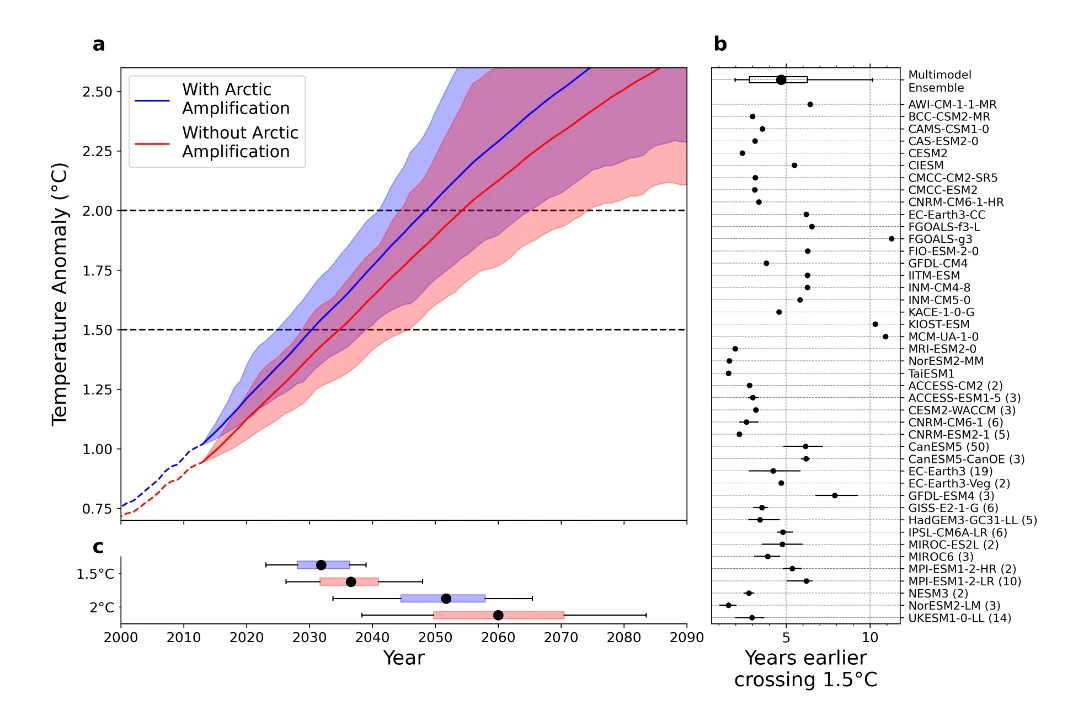
Figure 1. Effect of Arctic amplification on temperature rises above the Paris limits in CMIP6 models. (a) Observed (dashed lines) and CMIP6 projected global mean temperature anomalies relative to pre-industrial with and without Arctic amplification of warming. The CMIP6 projections are constructed from the first (or only) ensemble member of each model. All temperatures anomalies are 20-year, centred, rolling means. Projections are from the SSP2-4.5 emissions pathway and are scaled to diverge from the observed temperature anomaly, which results in a divergence in 2013, half the window-length prior to the present day. Central lines indicate multi-model means, shaded regions represent the spread between the 10% and 90% intervals. (b) Number of years earlier in which each CMIP6 model breaches the 1.5◦C temperature threshold as a result of amplified warming in the Arctic. For models with multiple ensemble members available, error bars show the range of this value across the full ensemble, and dots show the mean value, and numbers in brackets following the model names indicate the number of ensemble members used. For the multi-model ensemble, the box shows the 25th to 75th percentile range, and whiskers show the 5th to 95th percentile range. (c) Distributions of crossing years in the multi-model ensemble for the two temperature thresholds, with and without Arctic amplification. The box plots are defined as in (b). The mean number of years early with which each temperature threshold is crossed due to Arctic amplification is labelled. Both labelled differences are significant at a 99% confidence level using a one-sided t-test.
Related EGU articles
- Faster Arctic warming hastens 2C rise by eight years (14 November 2023)
Download
- Original image (148.8 KB, 1065.0x705.0 px)

