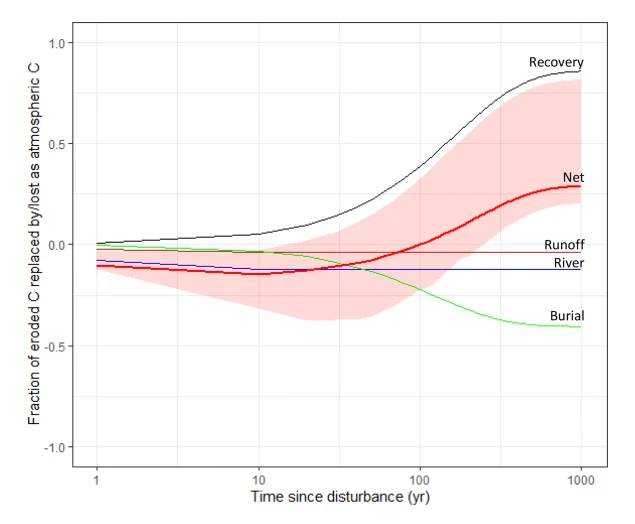
Framework to represent fraction gain and loss relative to mobilised soil OC for different components of the geomorphic cascade
The example shown here (full lines) uses the best estimates of model parameters described in the text and given in Table 2 (i.e., αrunoff D 0.04, τrunoff D 1, αriver D 0.5, τriver D 1, αburial D 0.54, τburial D 0.008, αrecovery D 0.86, τrecovery D 0.006). The red shaded area represents the uncertainty associated with the model parameters for the net overall effect (see Methods).
Related EGU articles
- New study settles long-standing debate: does agricultural erosion create a carbon sink or source (16 February 2023)
Download
- Original image (45.1 KB, 635.0x524.0 px)

