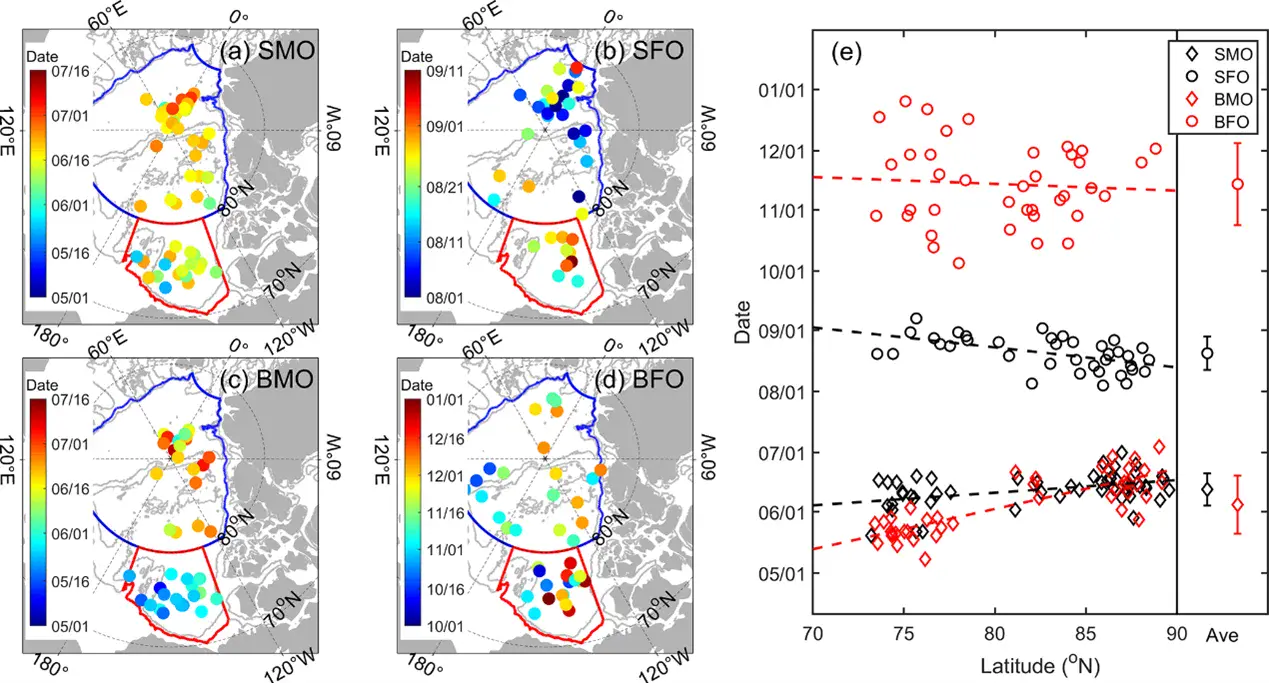
Timing of ice surface and bottom melt and freeze onsets of all sites
Timing of ice surface and bottom melt and freeze onsets of all sites: (a) SMO, (b) SFO, (c) BMO, and (d) BFO. The color codes (note the different scales for different panels) indicate the respective dates. Grey contours denote the 300 and 2000m isobaths. (e) Variations in dates of melt and freeze onset as a function of the latitude.
Related EGU articles
- The first complete picture of Arctic sea ice freeze-thaw cycle highlights sea ice response to climate change (5 December 2022)
Download
- Original image (416.5 KB, 1269.0x683.0 px)

