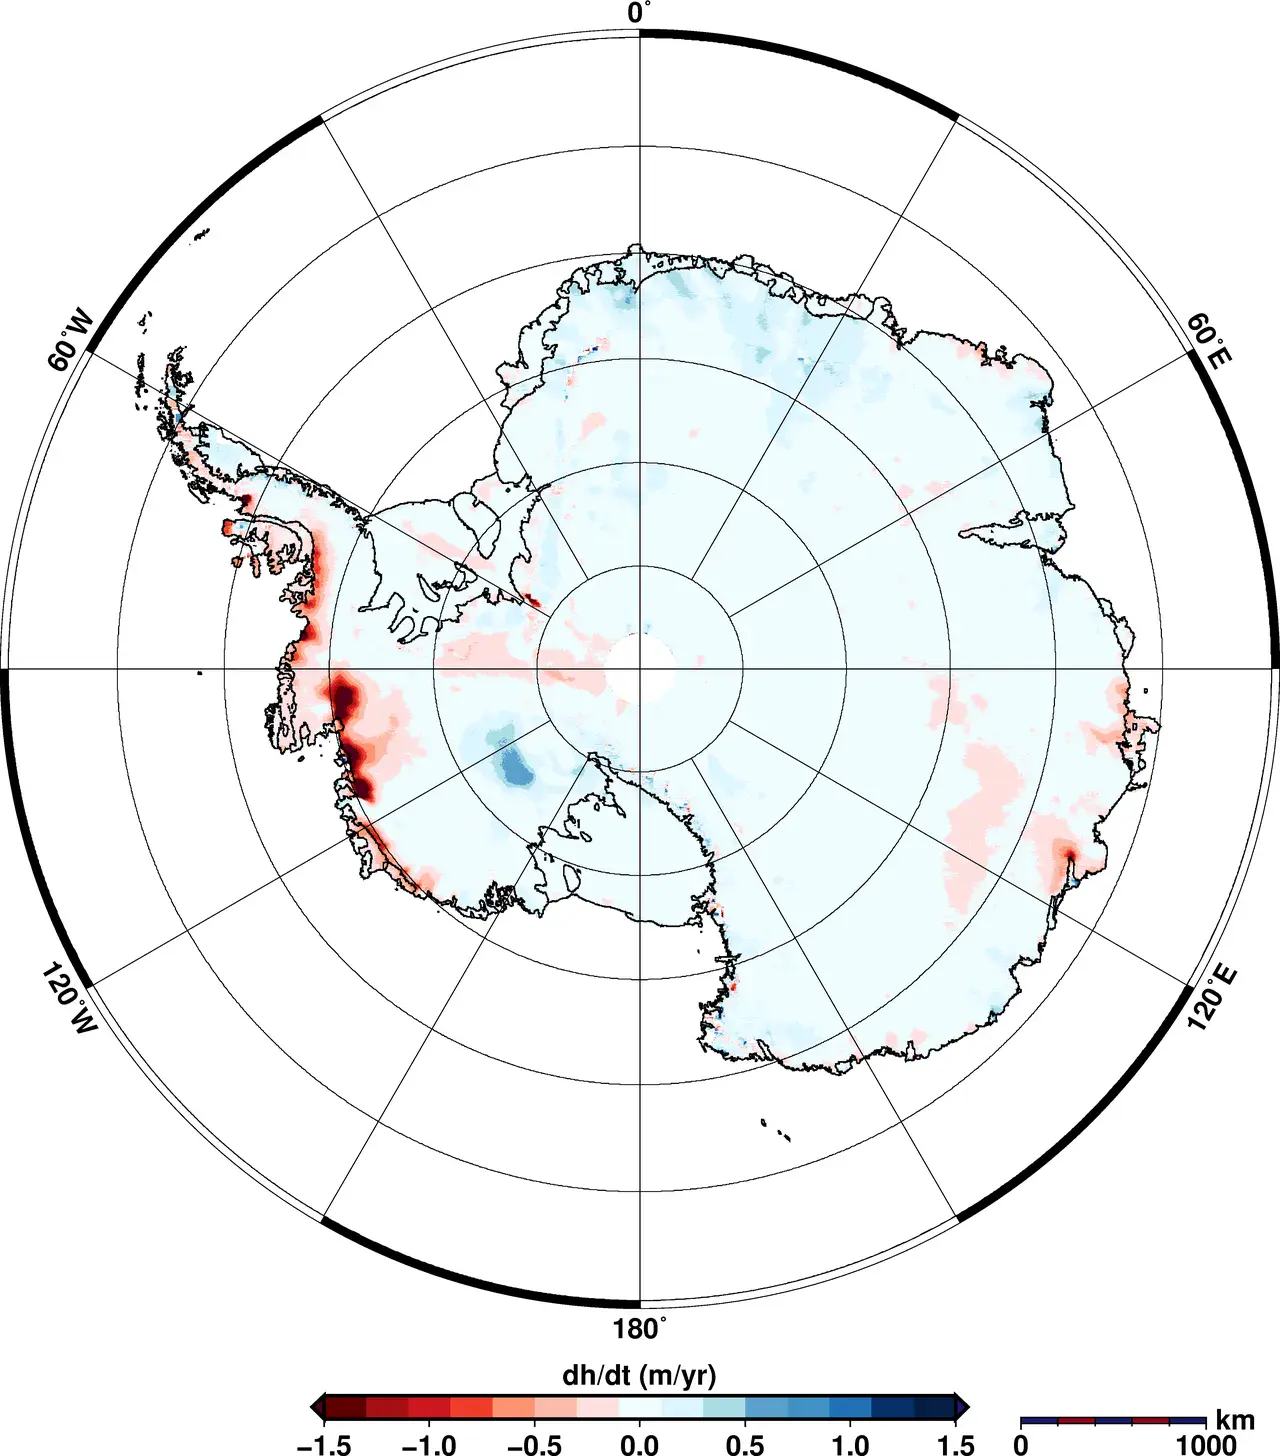
Elevation change in Antarctica
Map of elevation change in Antarctica between January 2011 and January 2014. Red indicates areas where the ice sheet lost mass in this period, while blue represents ice gains.
Credit: Helm et al., The Cryosphere, 2014
Related EGU articles
- Highs and lows: height changes in the ice sheets mapped (20 August 2014)
Download
- Original image (637.7 KB, 4596.0x5228.0 px)
- Preview image (107.8 KB, 1280x1456 px, JPEG format)

