This is a follow-up from a previous publication. Recently, a new analysis of the impact of Black Carbon in the Arctic was conducted within a European Union Action.
“Difficulty in evaluating, or even discerning, a particular landscape is related to the distance a culture has traveled from its own ancestral landscape. As temperate-zone people, we have long been ill-disposed toward deserts and expanses of tundra and ice. They have been wastelands for us; historically we have not cared at all what happened in them or to them. I am inclined to think, however, that this landscape is able to expose in startling ways the complacency of our thoughts about land in general. Its unfamiliar rhythms point up the narrow impetuosity of Western schedules, by simply changing the basis of the length of the day. And the periodically frozen Arctic Ocean is at present an insurmountable impediment to timely shipping. This land, for some, is irritatingly and uncharacteristically uncooperative.”
-Barry Lopez, Arctic Dreams, 1986
Study
Back in the 1980s the Arctic was a different place. It is one of the fastest changing regions of our planet and since then, Arctic sea ice volume has more than halved (Figure 1). Our study took place in the 2010s, when the Arctic moved into a new regime and sea ice volume showed unprecedented lows. In the last 3 years since our study ended this decline has just continued.
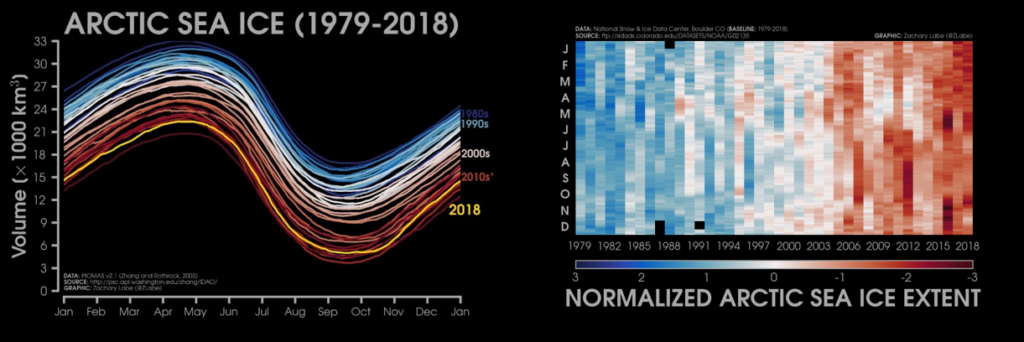
Figure 1: Satellite era (1979-2018) Arctic ice data. LEFT: Arctic sea ice volume, in 1000 km3 RIGHT: Normalized arctic sea ice extent. (Credit: Zachary Labe, Department of Earth System Science, The University of California, Irvine @ZLabe)
During 4 years, we collected small airborne particles at 5 different sites around the Arctic; 1 to 2 years per site. Later, we measured the concentrations and isotopic sources of black carbon (BC) aerosols, a product of incomplete combustion of biomass and fossil fuels, and a subfraction of the total collected aerosol.
All living organisms have more or less the same relative amount of radiocarbon atoms. We call it a similar ‘isotopic fingerprint’. Through photosynthesis plants take up CO2. About 1 in 1012 CO2 molecules contains the naturally occurring (but unstable) radiocarbon atom (14C), which is formed high up in the atmosphere through solar radiation. Black carbon from biomass burning thereby has a contemporary radiocarbon fingerprint. When plants die, the radiocarbon atoms are left to decay, and no new radiocarbon is being built into the plant. Radiocarbon’s half-life is 5730 years, which means that fossils and consequentially soot from fossil fuels is completely depleted of radiocarbon.
For the same periods and sites of our observations (see Figure 2), we also simulated black carbon concentration and sources.

Figure 2: Observational sites of our study. Clockwise from top: Utqiaġvik (formerly known as Barrow, Alaska), Tiksi Observatory (Siberia), Zeppelin Observatory (Svalbard), Abisko (Sweden), and Alert (Canada).
This was done with an atmospheric transport model (FLEXPART), using emission inventory data for fossil and biofuels (ECLIPSE), and biomass burning (GFED) (see Figure 3). Emission inventories like ECLIPSE calculate emissions of air pollutants and greenhouse gases in a consistent framework. They rely on international and national statistics of the amount of consumed energy sources for e.g., energy use, industrial production, and agricultural activities. GFED uses MODIS satellite measurements of daily burnt area. This is used – together with ’emission factors’ (i.e. amount of emitted species per consumed energy source unit) – to calculated emissions of several different gas and particle species. The details and methodologies have also been described in a previous EGU ASxCR blogpost.
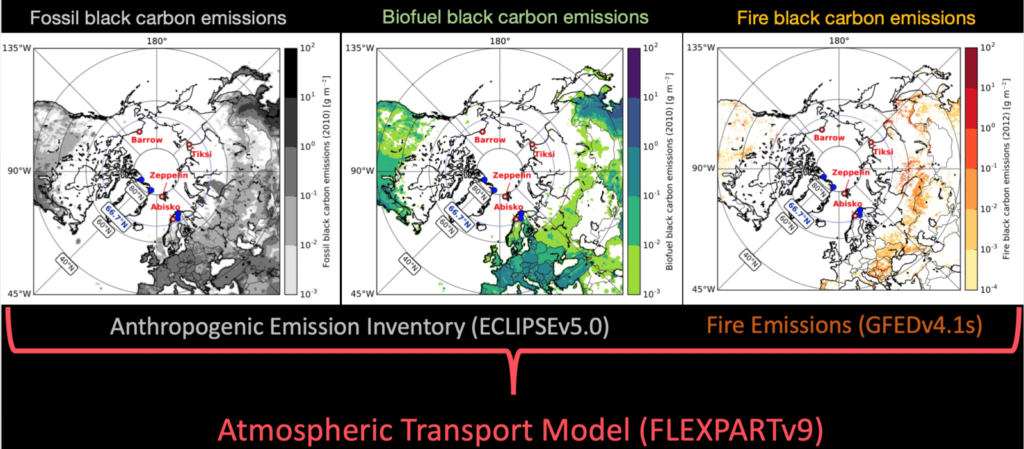
Figure 3: Model setup used in our study. Anthropogenic emissions of BC are from IIASA’s ECLIPSE emission inventory and biomass burning (wild fire and agricultural fires) are from the Global Fire Emission Database (GFED). The atmospheric transport model itself is FLEXPART, developed by NILU in Norway.
Black carbon, a short live climate pollutant (SLCP), is the second or more likely third largest warming agent in the atmosphere after the greenhouse gases carbon dioxide and methane. Unlike the two gases, it is less clear how big the net warming effect of BC is. There are several open questions, that lead to the current uncertainty: 1. How much BC is exactly put into the atmosphere? 2. How long does it stay in the air and where is it located? 3. Where from and where to is it transported, and where and when is it deposited? 4. How does it affect the earths radiative balance by darkening snow and ice, and most importantly of all: how does it interact with clouds. We have a fair understanding of all these processes, but still, relatively large uncertainties remain to be resolved. Depending on how much BC is in the air and where it is located in the atmosphere, it can have different effects (e.g., strong warming, warming, or even cooling). And all these things need to be measured, and simulated correctly by computer models.
Current multi-model best estimates by the Arctic Monitoring and Assessment Programme say that BC leads to increases of Arctic surface temperature of 0.6°C (0.4°C from BC in the atmosphere and 0.2°C from BC in snow) based on their radiative forcing (see Figure 4).
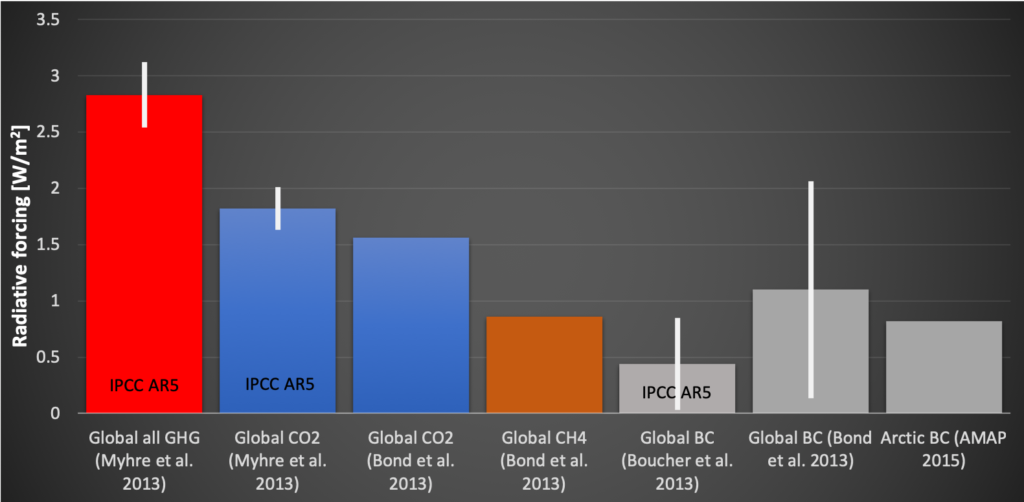
Figure 3: Radiative forcing for all greenhouse gases (GHG), carbon dioxide (CO2), methane (CH4), and black carbon (BC). All numbers are for global estimates, except the last bar to the right, which is for the Arctic only. Data according to the IPCC 5th Assessment Report (2013), an extensive review on black carbon (Bond et al. 2013), and best estimates by the Arctic Monitoring Assessment Programme (AMAP 2015). Range of uncertainties (if available) are shown as white vertical line.
It is important however to note, that our main focus on emission reduction should target (fossil-fuel) CO2 emissions, because they will affect the climate long after (several centuries) they have been emitted. And reduction in these sources means reduction in soot as well, since soot is also a combustion product. Reduction that targets soot specifically can be achieved by installation of particulate filters (retrofitting of old engines and stringent standard for new vehicles), shifting to cleaner fuels, burning techniques, or introduction and enforcement of inspection and maintenance programs to assure compliance with already existing legislation.
It is recognized internationally that for effective implementation of the Paris Agreement (mitigation effort to hold the average global temperature well below 2°C relative to the preindustrial levels), mitigation measures of short live climate pollutants (such as BC and methane) need to be considered. As the Arctic environment is more sensitive to climate change, knowing exactly which origins (source types and regions) are contributing to black carbon in this part of the world is important for effective mitigation measures.
Source attributions of black carbon depend on the altitude where the aerosol is located at the time of measurement or modelling. Wildfires are known to contribute more at higher elevations during the fire seasons (Paris et al., 2009) than at the Arctic surface. Several of the global chemical models have already approximately predicted the proportion of source influence but their accuracy depends on the emissions input and performance of the model. Part of this problem is, that these models get input from emission inventories. These inventories tell the model where, when and how much black carbon is emitted, kind of like instructions from a cookbook.
But the different cook books don’t agree on the amount of black carbon that goes into our annual black carbon cake. Additionally, all the different cookbooks have different recipes for different years. If we take a best estimate of global black carbon emissions, our annual cake has about the size (and weight; because of similar densities of limestone/granite and soot) of the great pyramid of Giza (7500 gigagrams). But the range of estimates vary immensely (2000-29000 gigagrams) (see Figure 5). And these numbers are only for man-made emissions (fossil fuels and biofuels) i.e. excluding wildfires and natural biomass burning. A recent multi-model analysis puts global annual BC fire emissions between 1000 and 6000 gigagrams. To correct these models and the emission inventories we rely on observational data to validate the model results.
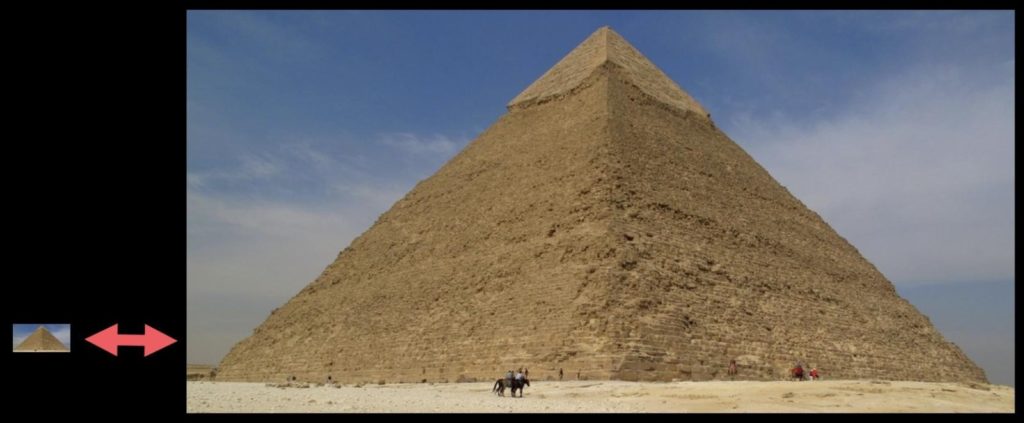
Figure 5: Uncertainty in global annual BC emissions ranges from 2000 to 29000 Gg (according to Bond et al. 2013
The model set-up we used did really well in simulating soot concentrations. A bit less well in simulating fuel types (sources) – better for fossil fuels than biofuels and biomass burning. The model simulated that 90% of BC emissions (by mass) – reaching surface level – in the Arctic originated form countries north of 42°N.
In our isotope measurements, we found that black carbon sources had a strong seasonality, with high contributions of fossil fuels to black carbon in the winter (75%) and moderate (60%) in the summer. Black carbon concentrations where roughly four times higher in winter than in summer. Concentrations of black carbon at the different stations were also relatively different from each other. These surface level (<500m above sea level) Pan-Arctic results, based on our 14C method, were not very surprising. Few individual locations, as used in our latest study, have previously been published and had similar sources(e.g., Barrett et al., 2015. Winiger, et al, 2015, 2016). However, the sources in our study were relatively uniform for all stations and almost in seasonal sync with each other (high fossil winter, low fossil summer). This could have important implications for policy related questions.
Uniform sources could mean that mitigation measures could have a stronger impact, if the right sources are tackled at the right time, to keep the Arctic from becoming a small ice floe, not large enough to stand on. There could be brighter days ahead of us.
Edited by Dasaraden Mauree
 Patrik Winiger is Research Manager at the ETH Zürich and guest researcher at the Department of Earth Sciences, Vrije Universiteit Amsterdam. His research interest focuses on sources and impact of natural and anthropogenic Short Lived Climate Pollutants and Greenhouse Gases. He tweets as @PatrikWiniger.

