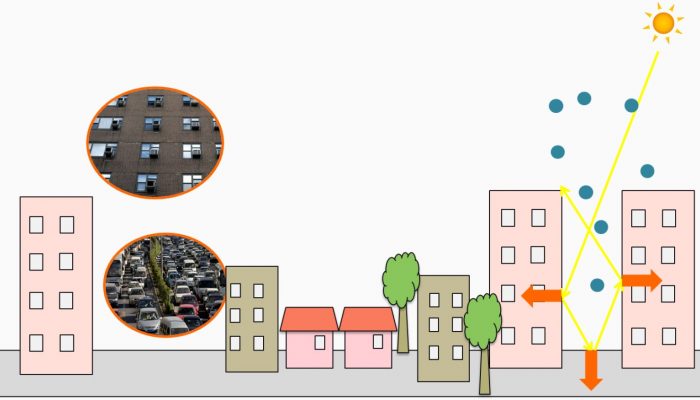
Cities obviously experience a different climate than natural landscapes. Already in 1810 the British meteorologist Luke Howard documented that the air temperature in the city of London was several degrees higher than in its surroundings. This so called urban heat island has several causes. In general the relatively dark surfaces of asphalt and roofs absorb solar radiation very efficiently and this heat is stored in building material during the day. At night this heat is released to the atmosphere, which keeps the city warm. Moreover, heat produced by air conditioning, traffic and industry contributes substantially to a city’s heat load. With a decreased amount of vegetation, cities also lose the shade and cooling effect of trees (Figure 1).
Currently already over 50% of the world’s population is residing in urban areas and this number is foreseen to increase even further in the future. Moreover, climate model projections indicate that heat waves will occur more often in the future. Together these developments will make many citizens potentially vulnerable to urban heat. Although a slight temperature increase might look appreciable at first glance, elevated temperatures affect human health, since hospital visits and mortality are enhanced in warm conditions (about 2% per degree Celsius, e.g. Hajat et al., 2002). In addition, labour productivity in warm periods is reduced, resulting in economic losses. E.g. for Australia this was estimated to be about $650 per capita (Zander et al, 2015) which is a substantial contribution to the national income. Also, the urban energy demand needed for heating purposes in winter and cooling in summer is governed by urban weather. Finally cities are vulnerable to flooding in case of extreme precipitation by peak showers, when the sewage system capacity is hampered. Hence how do cities manage urban heat and keep dry feet?
Behind the general picture on the urban heat island, several scientific questions do remain. E.g. what is the temperature variability within a city, and how can we monitor temperatures? Also, can we make special weather forecasts for cities? Monitoring urban weather and climate is challenging since traditional weather stations are not suitable for urban areas since they require undisturbed terrain. Crowdsourcing, i.e. the collection of weather data by citizens has now become popular. Many hobby meteorologists have installed weather stations at home, and distribute their data directly via several websites as www.wunderground.com, www.netatmo.com, and www.wow.metoffice.gov.uk. These crowdsourced observations were crucial in estimation of the urban heat island effect in the Netherlands, a west-European country with a mild maritime climate were little attention was paid to urban climate. On hot summer days the urban heat island was over 6 degrees (Steeneveld et al., 2011, Heusinkveld et al., 2014)!
The urban climate can be efficiently monitored by tricycle traverse measurements (Figure 2). Bikes are excellent modules to measure the urban climate, since a wide variety of urban morphology (vegetation cover, building design and material) can be explored, especially outside the main roads. And it is carbon free, all driven by electricity generated by solar panels. Moreover, the bike is appealing for the general public.
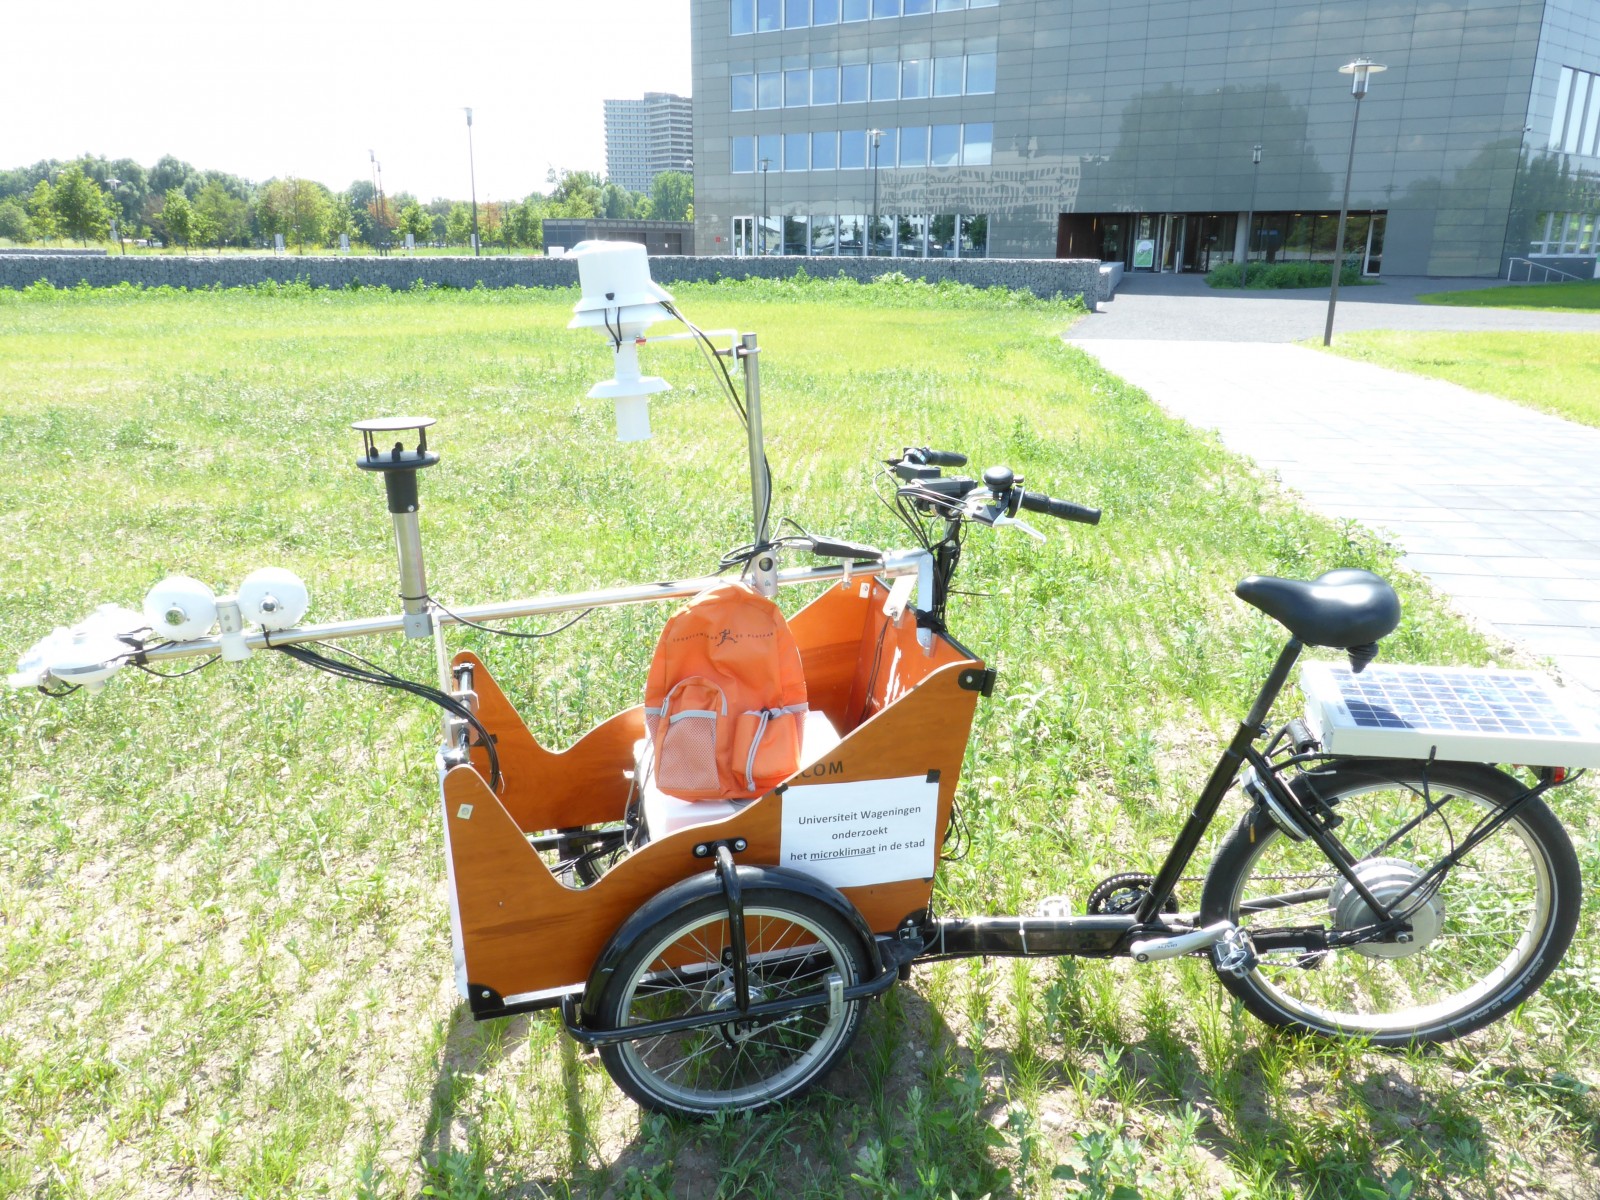
Figure 2: A cargo tricycle equipped with a weather station to measure temperature, humidity, wind speed, solar and thermal radiation (source: Wageningen University; design Bert Heusinkveld).
What do we learn from such bike traverses? Figure 3 shows the variety of temperatures observed during a heat wave in a mid-size town in the Netherlands. Obviously, local temperature differences at the end of the afternoon may reach up to 3.5 ºC in this case. In general the town centre is relatively warm, though more surprisingly the relatively young neighbourhoods at the city edges appear to be warm too. In these neighbourhoods the vegetation is young, resulting in limited shadowing and therefore efficient heat absorption in roads and building walls. Local cool spots appear in parks and at small lakes. Luckily, enough room to escape from the heat!
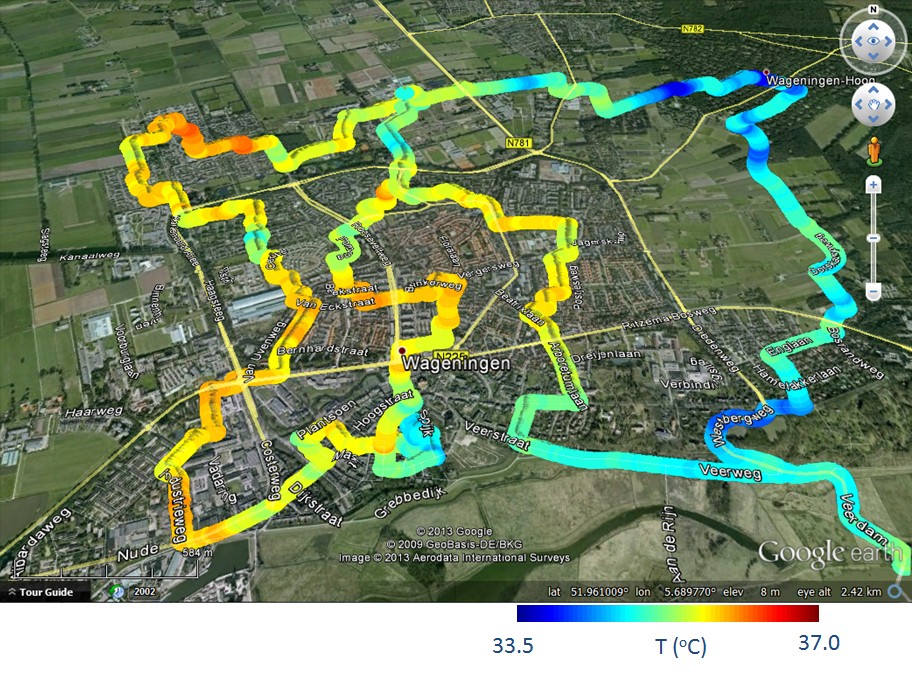
Figure 3: Air temperature observations in the mid-size town Wageningen (the Netherlands, August 2nd 2013, 17.00 local time) obtained from two bike traverses. Source land cover maps: googlemaps.com.
No weather station in your garden? We still catch you via your smartphone! Smartphone users with the OpenSignal App that is intended to monitor wireless network capacity provide as a by product the smartphone battery temperature. Recently it was discovered that the temperature of your smartphone battery follows the air temperature outdoor (Overeem et al., 2013). Inversely this means that if we know the smartphone battery temperature, we can estimated the outdoor temperature. This insight offers a high potential for recording urban temperatures in areas where observations are rather scarce. The open question remains whether spatial and temporal scales these observations are applicable. Is it possible to get a reliable temperature record for your neighbourhood via available smartphones. Also, will these modern Big Data techniques change the paradigm on performing traditional measurements?
Weather forecasts on TV and radio never focus on the detailed weather for cities, which is somewhat surprising since many human activities, human health and critical infrastructures depend on the city temperature. Since computer power has rapidly grown the last decades, and still is, weather forecast models have refined their grid spacing. With this refinement urban areas “become visible” for these models. On one hand this offers a great potential for city specific forecasts. On the other hand information about the urban morphology is needed to feed these weather forecast models. For example they need to know whether urban districts contain skyscrapers or just three-story residential areas, and for example how much vegetation is present. Thereto the World Urban Database and Portal Tool is set up in which local experts document their city. You are welcome to join to describe your city and inform our weather forecast models how your city looks like!
References
- Heusinkveld, B.G., G.J. Steeneveld, L.W.A. van Hove, C.M.J. Jacobs, and A.A.M. Holtslag 2014: Spatial variability of the Rotterdam urban heat island as influenced by urban land use, J. Geophys. Res, 119, 677–692.
- Overeem, A., J. C. R. Robinson, H. Leijnse, G. J. Steeneveld, B. K. P. Horn, and R. Uijlenhoet (2013), Crowdsourcing urban air temperatures from smartphone battery temperatures, Geophys. Res. Lett., 40, 4081–4085, doi:10.1002/grl.50786
- Steeneveld, G.J., S. Koopmans, B.G. Heusinkveld, L.W.A. van Hove, and A.A.M. Holtslag, 2011: Quantifying urban heat island effects and human comfort for cities of variable size and urban morphology in The Netherlands, J. Geophys. Res., 116, D20129, doi:10.1029/2011JD015988.
- Zander, K.K., W.J.W. Botzen, E. Oppermann, T. Kjellstrom, S.T. Garnett, 2015: Heat stress causes substantial labour productivity loss in Australia, Nature Climate Change 5, 647–651.
Edited by Célia Sapart and Caroline Jacques