It might seem obvious that a warming world will lead to a reduction in glacial ice cover, but predicting the response of glaciers to climatic change is no simple task (even within the short term). One way to approach this problem is to come up with relationships which describe how glaciers interact with the world around them, for example, how the ice interacts with the air above it. Our post today delves into the world of ice-air interaction and describes some of the problems encountered by those who are investigating it, in particular the problem of modelling katabatic winds! Not sure what we are talking about…then read on to find out more!
What are katabatic winds?
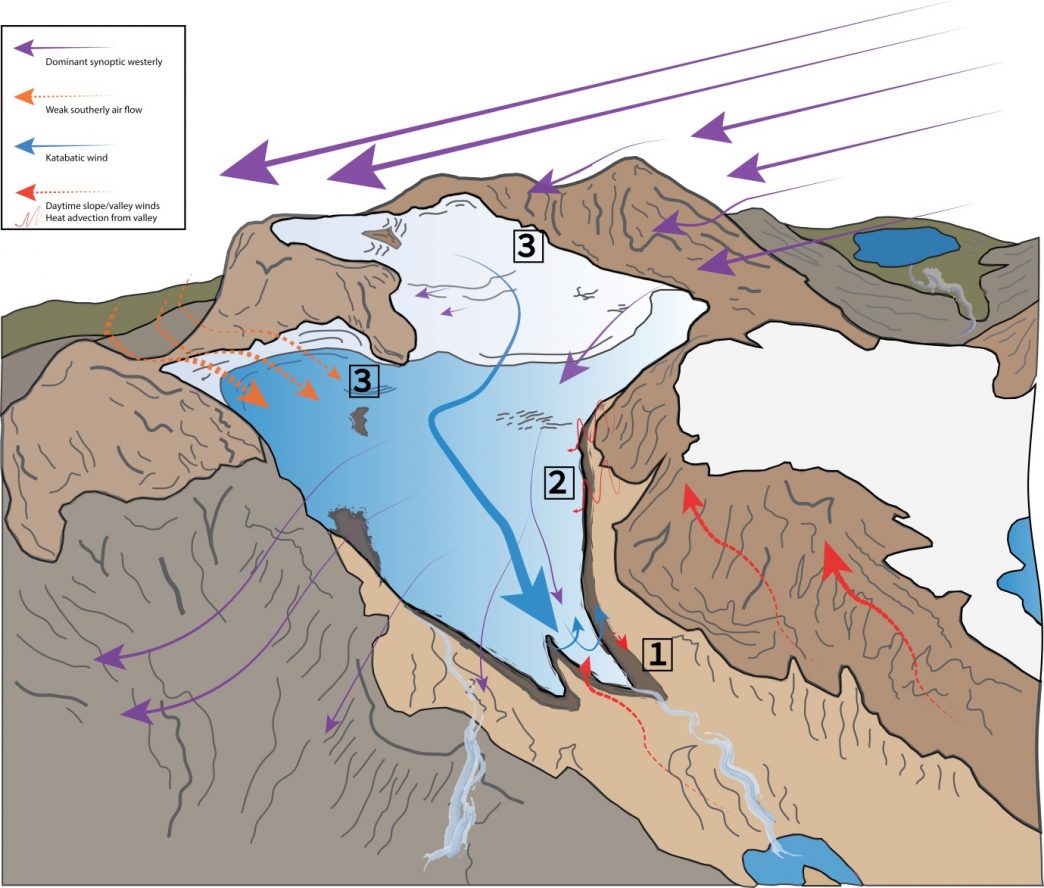
Anyone who has stood on, or in front of a glacier on a clear, sunny day has no doubt felt the bitter chill of a katabatic wind, forcing them to don a warm jacket and lose their chance at that lovely “glacier tan”. Katabatic winds (derived from the Greek word katabasis, meaning ‘downhill’) develop over snow and ice surfaces because the 0°C ice surface cools the air just above it. This cold, dense air then flows downhill under the force of gravity (Fig. 1 and Fig. 2). This is not recent news and such wind chill has no doubt punished glaciologists and explorers for the last century or more – Mawson’s Description of the 1911-1914 Australian Antarctica Expedition is aptly named “The Home of the Blizzard“. However, despite being well known, this phenomenon still causes much uncertainty when it comes to modelling the melting of glacier ice surfaces around the world.
Soon gusts swept the tops of the rocky ridges, gradually descending to throw up the snow at a lower level. Then a volley raked the Hut, and within a few minutes we were once more enveloped in a sea of drifting snow, and the wind blew stronger than ever. – Mawson, 1915, The Home of the Blizzard
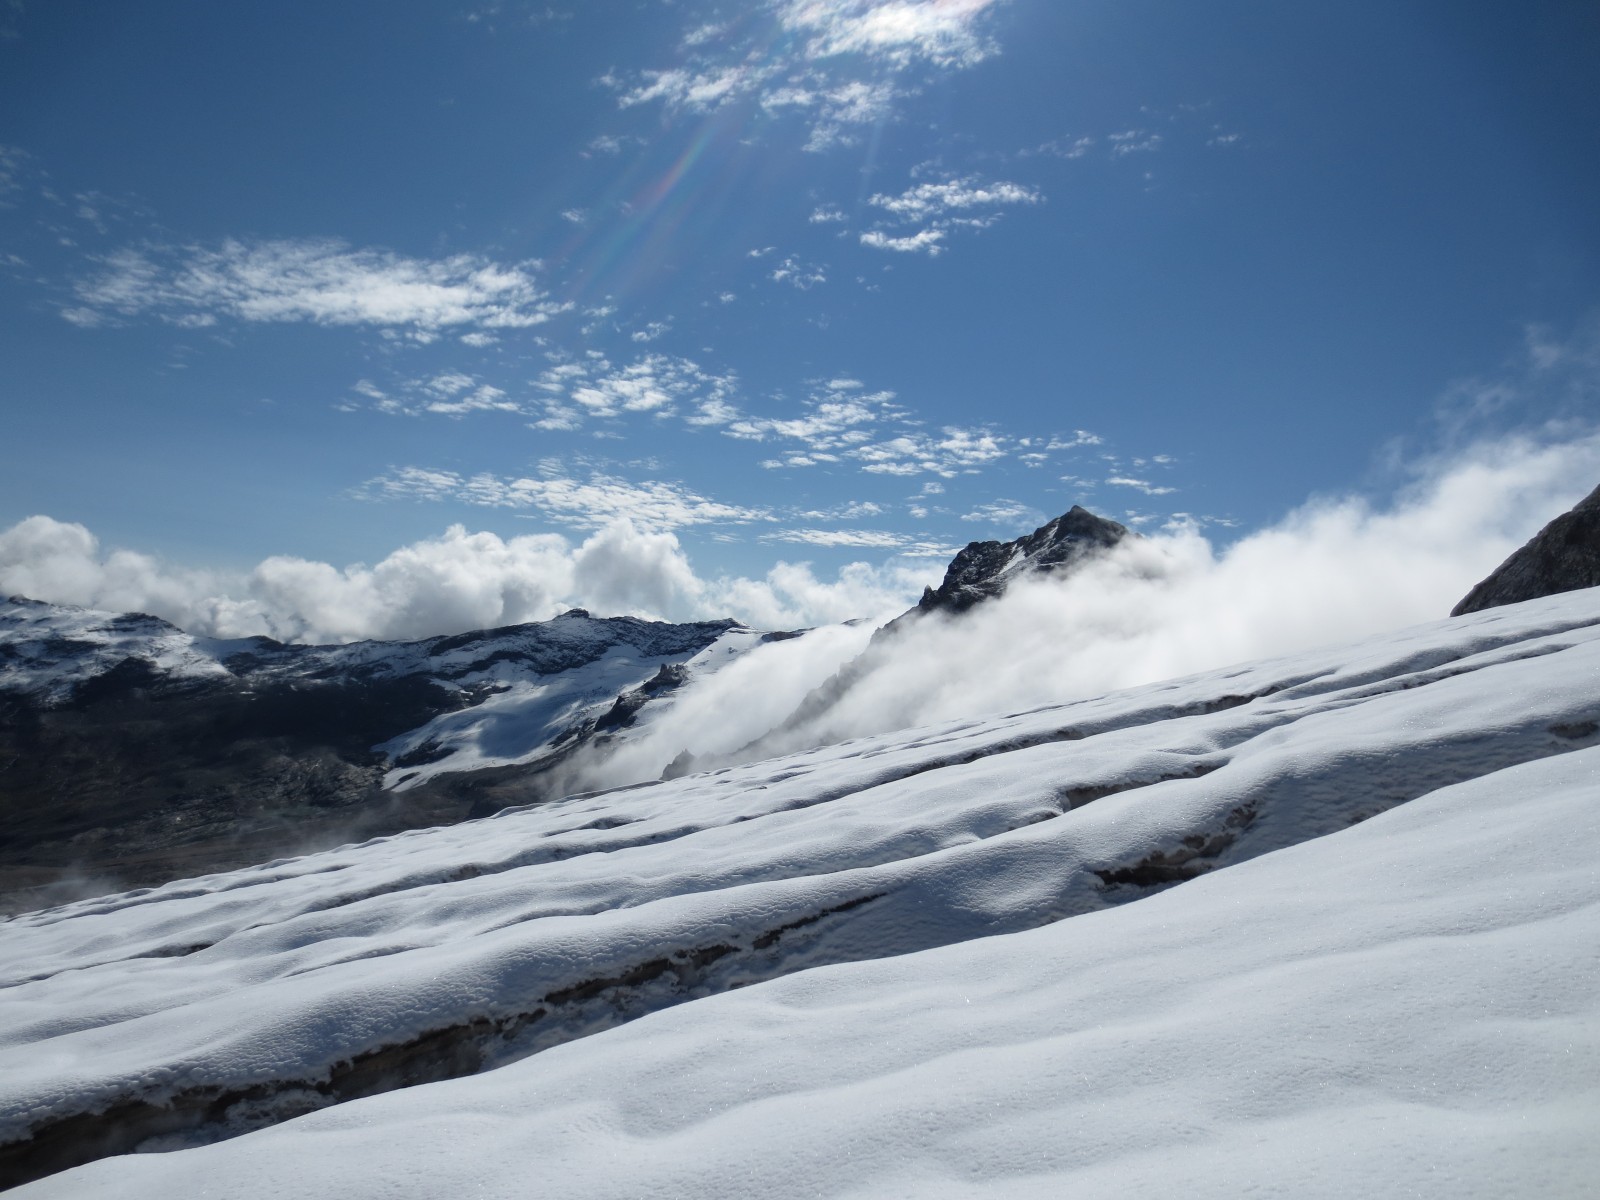
Figure 2: The view from the upper reaches of Tsanteleina Glacier in the western Italian Alps (Val d’Rhemes, Aosta). Katabatic winds generally flow in a down-glacier direction – here, from right to left [Credit: T Shaw].
Challenges for modelling
Air temperature is really important in determining how much a glacier melts and we need to know as much about it as possible to provide accurate predictions now and into the future. This is particularly relevant because the warmer it gets, the more energy is available to melt ice and seasonal snow. Unfortunately though, we don’t have an infinite supply of meteorological observations (e.g. air temperature, wind speed etc) at many locations we are interested in. As a result, we have to make simple assumptions about what the weather is doing at a remote, far away glacier. One such simple assumption is based upon the fact that air temperature typically decreases with increasing elevation, and so if we know the elevation of a location we are interested in, we can assume a ‘likely’ temperature. The rate of change in temperature with elevation is known as a ‘lapse rate’.
Air temperature is really important in determining how much a glacier melts…the warmer it gets, the more energy is available to melt ice and seasonal snow.
When predicting glacier melt, it is common practice to use a lapse rate which stays constant in time and space. This is convenient as we often don’t know the actual lapse rate at a given location, but this often ignores things happening at the surface of the Earth. An important example of this is when we have katabatic winds over glaciers!
When conditions are warm, and skies are clear, the cooling of the air above the ice surface, means that the application of a lapse rate is fairly useless, or close to it [Greuell and Böhm, 1998]! That is because the cooling from the surface continues as air flows down the glacier, typically creating colder temperatures at lower elevations, the opposite of the typical lapse rate assumption that models will apply.
‘Bow-shaped’ temperature vs. elevation relationships
To complicate matters for people trying to model the air temperature over glaciers, the effect of surface cooling is not just dependent on the amount of time an air parcel is in contact with the ice surface but also the characteristics of the ice surface it has been in contact with. In fact, after cooling on their descent down-glacier, air parcels have been documented to warm again, leaving interesting slightly “bow-shaped” curves to the temperature-elevation relationship. This effect has been found for the Swiss Haut Glacier d’Arolla and the Italian Tsanteleina Glacier (Fig. 3c,d). A new model approach to tackling this bow-shaped problem has been presented by recent research [Ayala et al., 2015] and offers a means of accounting for katabatic winds in glacier models. Nevertheless, more data and more work are still needed to generalise these models [Shaw et al., in review].
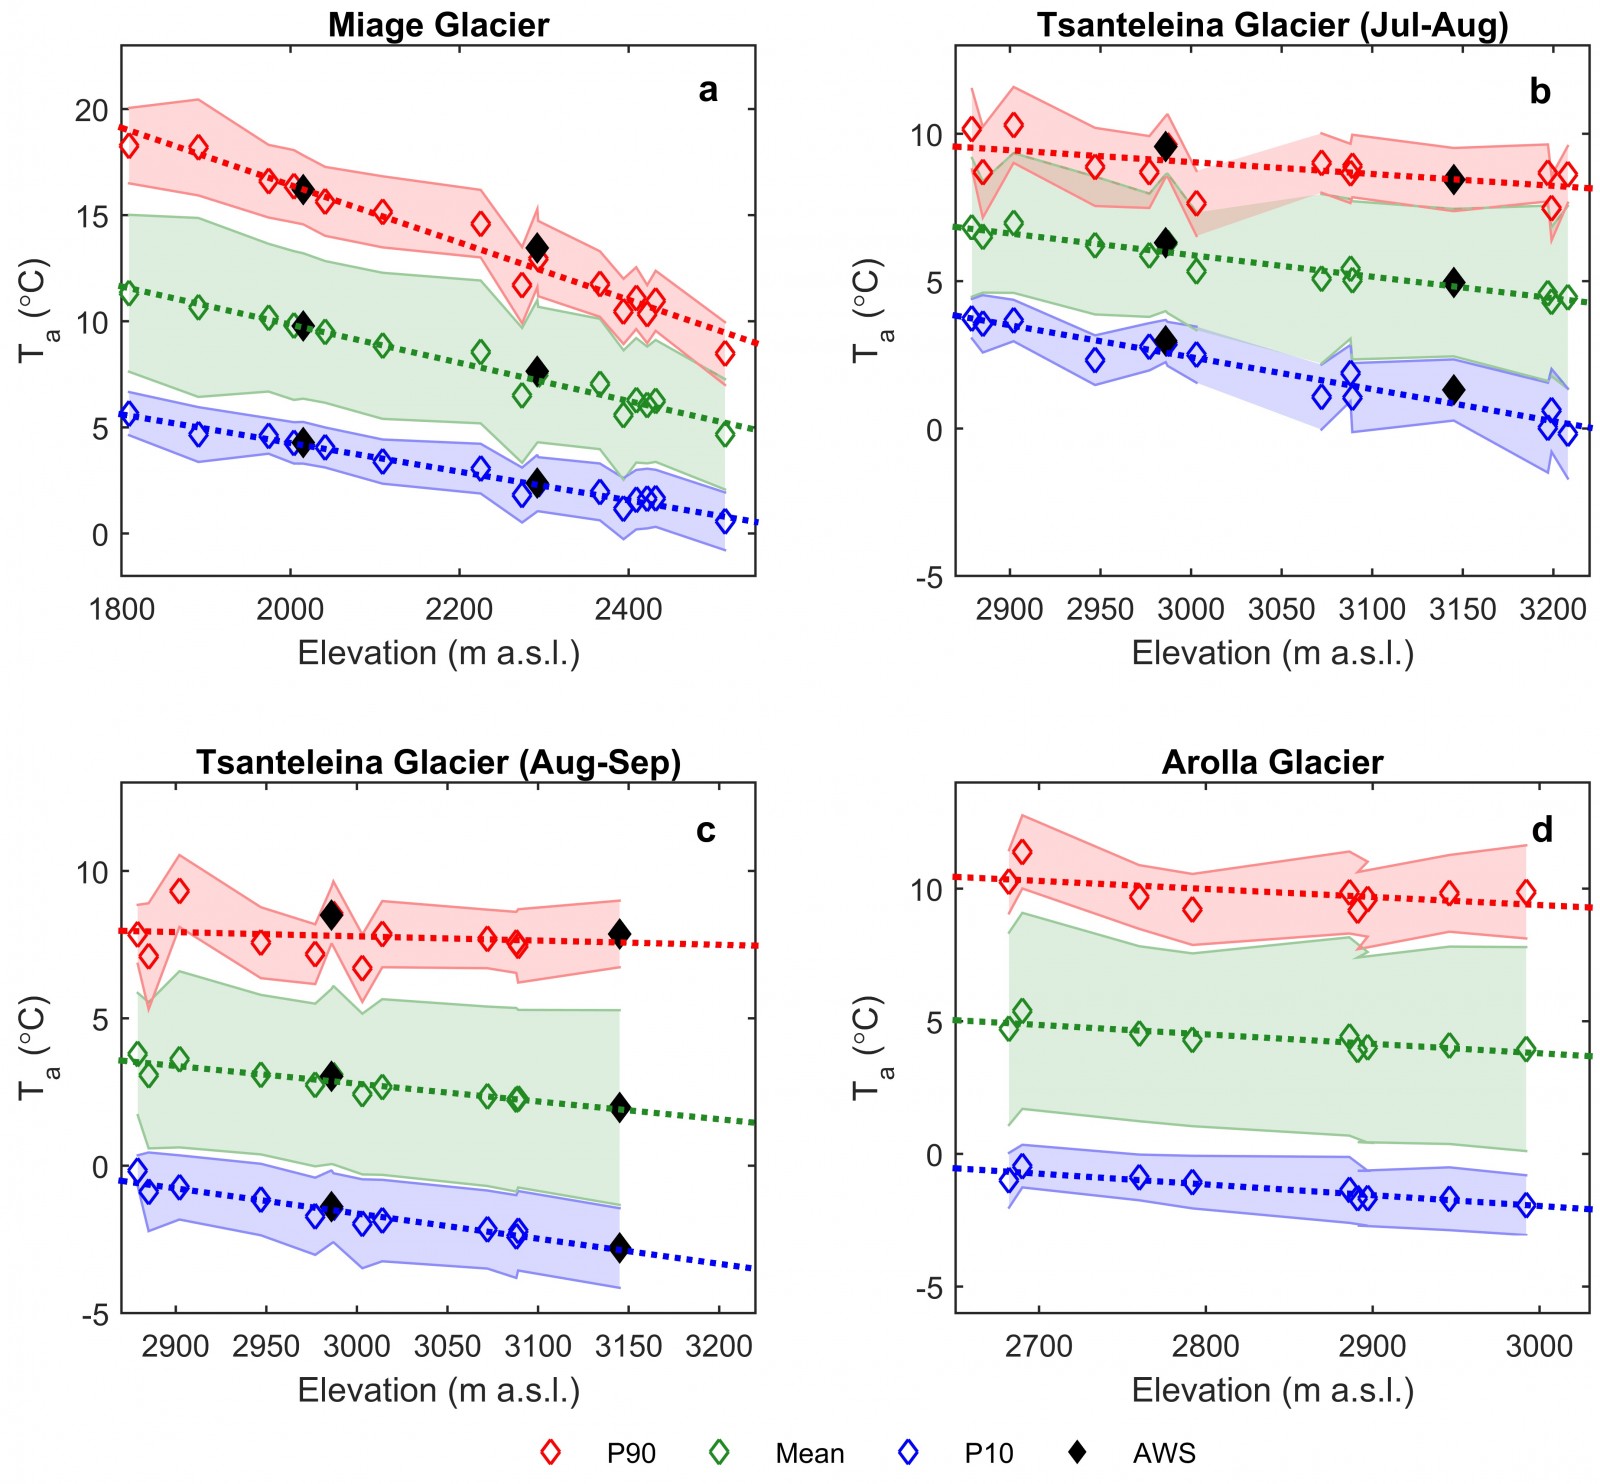
Figure 3: Relationship between elevation and air temperature on three different glaciers in the western Alps. Miage (Italy), Tsanteleina (Italy) and Arolla (Switzerland). Glaciers are represented using the mean of all data available (green), the top 10% of off-glacier temperatures (P90 – red) and the bottom 10% of off-glacier temperatures (P10 – blue), plus one standard deviation. The debris-covered Miage Glacier does not demonstrate a classic katabatic flow regime and therefore temperature corresponds well to elevation even under warm conditions [Credit: T Shaw, unpublished].
after cooling on their descent down-glacier, air parcels have been documented to warm again, leaving interesting slightly “bow-shaped” curves to the temperature-elevation relationship.
Air temperatures across debris-covered glaciers
As you may have read in our previous post on the topic, debris-covered glaciers behave in a different way to those with a clean ice surface. Detailed observations of air temperature across a debris-covered glacier show that the glacier responds to the heating of surface debris in the sunlight and a consequent warming of the lower atmosphere [Shaw et al., 2016]. Because of this, air temperature conforms very strongly to the elevation dependency that is assumed when using a lapse rate. Although very local variations of air temperature on other debris-covered glaciers cannot be well estimated by a lapse rate [Steiner and Pellicciotti, 2016], the insulating effect of thick debris cover means that the current approach to using simple lapse rates for estimating air temperature over debris-covered glaciers could be suitable.
Nevertheless, challenges for accurately representing air temperature above glaciers without debris cover remain. The fact that globally averaged temperatures are expected to rise over the current century (areas at high latitudes have shown a stronger warming trend) [Collins et al, 2013], the applicability of using lapse rates could further diminish. Recent patterns of warmer-than-average temperatures also suggest a difficulty of accurately estimating on-glacier temperatures in the short-term. For example, for the period of May 2015 – August 2016, every month beat the previously held record for warmest globally average temperature (GISTEMP). Imagine the bow-shaped problem to that!
Edited by Matt Westoby and Emma Smith
 Thomas Shaw is a PhD student in the Department of Geography at Northumbria University, UK. His research is focused on the spatial and temporal variance in near-surface air temperature across debris-covered and debris-free glaciers in the western Italian Alps. As well as conducting research in the Alps, he is also very interested in glaciers and their processes on Svalbard (Norwegian Arctic) and has spent plenty of time studying above, or within (!), ice at high latitudes. Contact e-mail: thomas.shaw@northumbria.ac.uk


Pingback: Cryospheric Sciences | Image of the Week — Hidden lakes in East Antarctica !
Pingback: Video of the Week: Glaciers and Cloud Patterns - GlacierHub
Pingback: Cryospheric Sciences | It’s not you, it’s me(lange): ice shelf break-up triggered by mélange and sea-ice loss