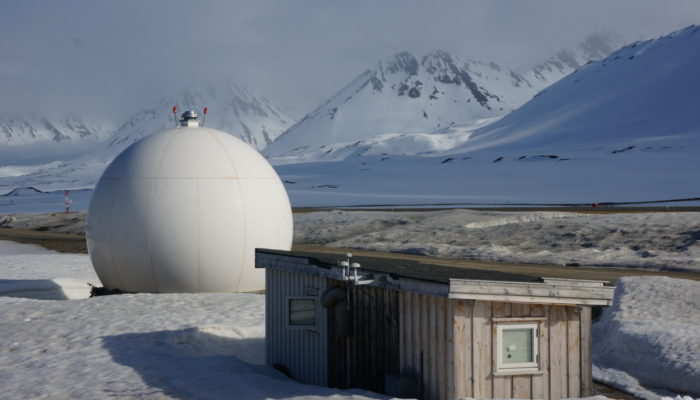
Primary downlink station for the Gravity Recovery and Climate Experiment (GRACE) and GRACE-Follow On satellite data in Ny-Ålesund, a town in Svalbard, operated as crucial part of the Ground Data System by the Helmholtz Centre Potsdam German Research Center for Geosciences for the joint mission with the NASA Jet Propulsion Laboratory. Source: Carsten Falck from the German Research Center for Geosciences.
After decades of observation, one of the profound consequences of anthropogenic global warming is the rapid rise in temperature in the Arctic, refered to as Arctic Amplification. Compared to the mid-latitudes, warming in the Arctic is twice as fast. The reason is mainly due to the positive feedback of a melting cryosphere: Darker surfaces are revealed from melting cryosphere, reflecting less shortwave radiation (sunlight) which gets absorbed and converted to longwave radiation (heat). Those darker surfaces can either be land surfaces below snow/ice cover or water bodies covered by lake/sea ice. The additional heat generated by this process will then cause further melting, reinforcing the positive feedback process.
This rapid local warming triggers many issues, from detrimental impact on human infrastructure, threatening indigenous communities, rising sea levels to the release of greenhouse gases trapped in frozen soils and lakes [1, 2, 3, 4]. The warming can also shift energy balances on a global level. The large-scale wind circulation on our planet is driven by temperature differences. The difference between the hot tropics and cool polar regions, together with the Earth’s rotation, creates winds that our ecology and society have adapted for the last 12,000 years. A common example of these winds is called the Jetstream, a mid-latitude and high-altitude wind blowing from west to east in both hemispheres. Drastic changes in the direction or the speed of such winds would have large consequences for our society such as extended droughts and flooding.
The extent to which Arctic Amplification alters those winds leading to extreme changes in climate on Earth has been a subject of strong scientific debate (which you can witness at every EGU General Assembly). While some modeled experiments suggest a strong influence on our winds, others models do not show such effect [5]. Coordinated experiments where scientists can modulate the Arctic climate in dozens of models and terabytes of data are supposed to shed a light on these issue, but results are still all over the place [6]. Analyzing observed climate seems to suggest this is really happening, but we can not be certain given that 30 years of data is too short to exclude the impact of noise in the data [7, 8, 9]. This calls for further investigation of the involving process to create a good scientific base for mitigation and adaptation measures.
Recently, in a Nature Climate Change article, we showed that Arctic glaciers do, in fact, record a change in Arctic winds [10]; a change that has not been seen for the last 70 years. This is quite remarkable, given that glaciers are very large and slow which makes them a good observer in this case. They filter out a lot of noise.
So, how exactly does this work?
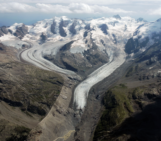
According to satellite and local measurements, the Arctic cryosphere is melting, and so are the glaciers in Northern Canada and Svalbard (an island chain in the Atlantic, north of Norway). Figure 1 shows a steep downward trend in ice mass per year between 2002 to 2021 alone. The annual ice mass loss of these two regions is significant, equivalent to 44 billion tons of water. That is a lot of water being released each year!
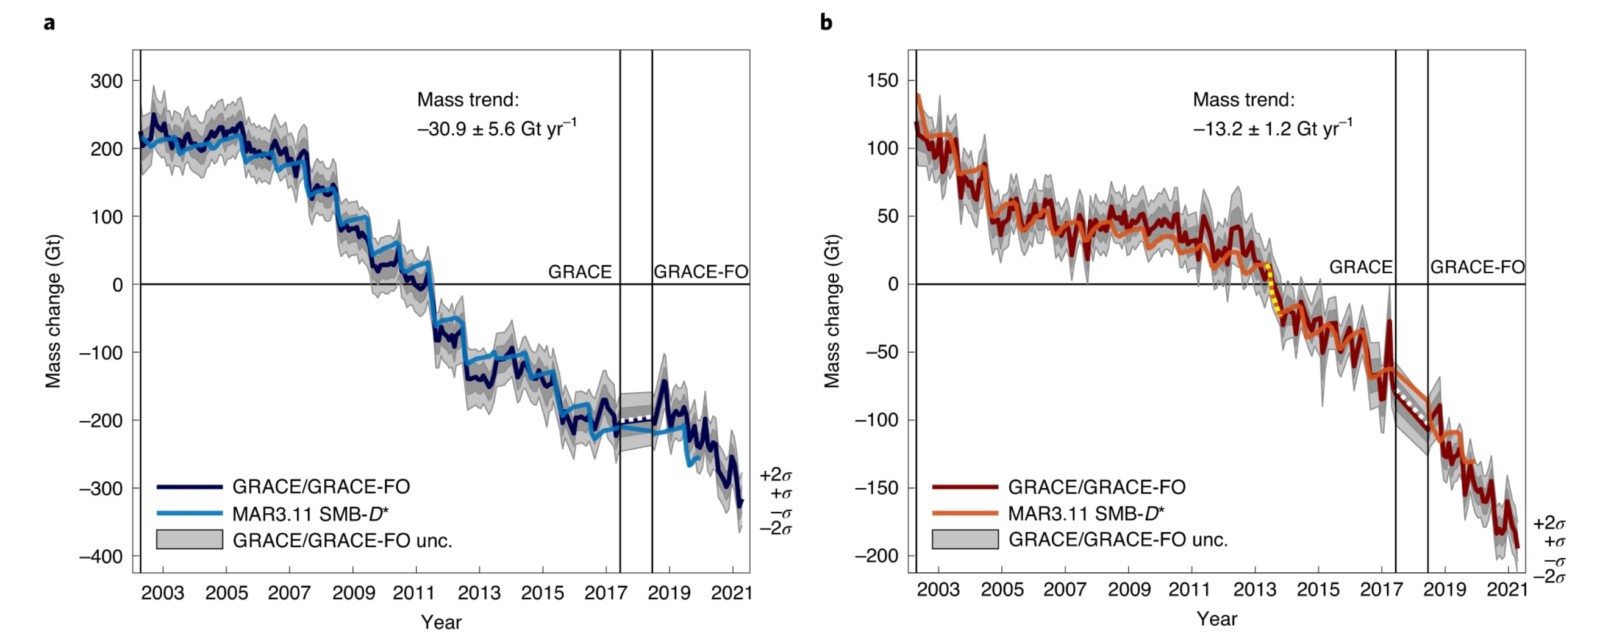
Figure 1: Mass change per year from 2002–2021 for a) the Northern Canada glaciers and b) Svalbard glaciers [10].
Naturally, the melting rate will be different each year (here: melting seasons aka summer). For instance, less melting might occur in summers with a lot of cloud cover, snowfall or when cold air masses are shuffled towards the glacier. In figure 1, positive bumps show years with slower melting and negative bumps indicate the years with faster melting. As noted before, a large part of these bumps is created by the kind of air that is flowing towards and over the glacier. Dry warm air speeds up melting while cold wet air slows it down. Simply put, for our two Arctic glacier regions this mostly means 1) air coming from the north is cold and 2) air coming from the south is warm.
Now, both glacier regions are roughly at the same latitude and are mostly affected by westwinds. Therefore, they should generally be exposed to the same air mass characteristics at about the same point in time. This seems to have been the case for the last 50 years of the 20th century [Figure 2]: In summers both the Canadian glaciers and the Norwegian glaciers melt significantly. However, since the year 2000, concurrent with an increase in warming, the two glaciers each experience a different kind of air mass at the same time: In years where Canadian glaciers experience an increased melting rate, the Norwegian glaciers melt less, and vice versa [Figure 2].
But how is that possible?
Our theory suggests that with strong Arctic warming, the westerly winds become weaker and more air masses can come in from the north and south. In other words, the stream of westerly winds gets wavier, like a rubber band [Figure 3]. In that way, Canadian glaciers can be impacted by warm air from the south and at the same time Norwegian glaciers can be influenced by cold air from the north.
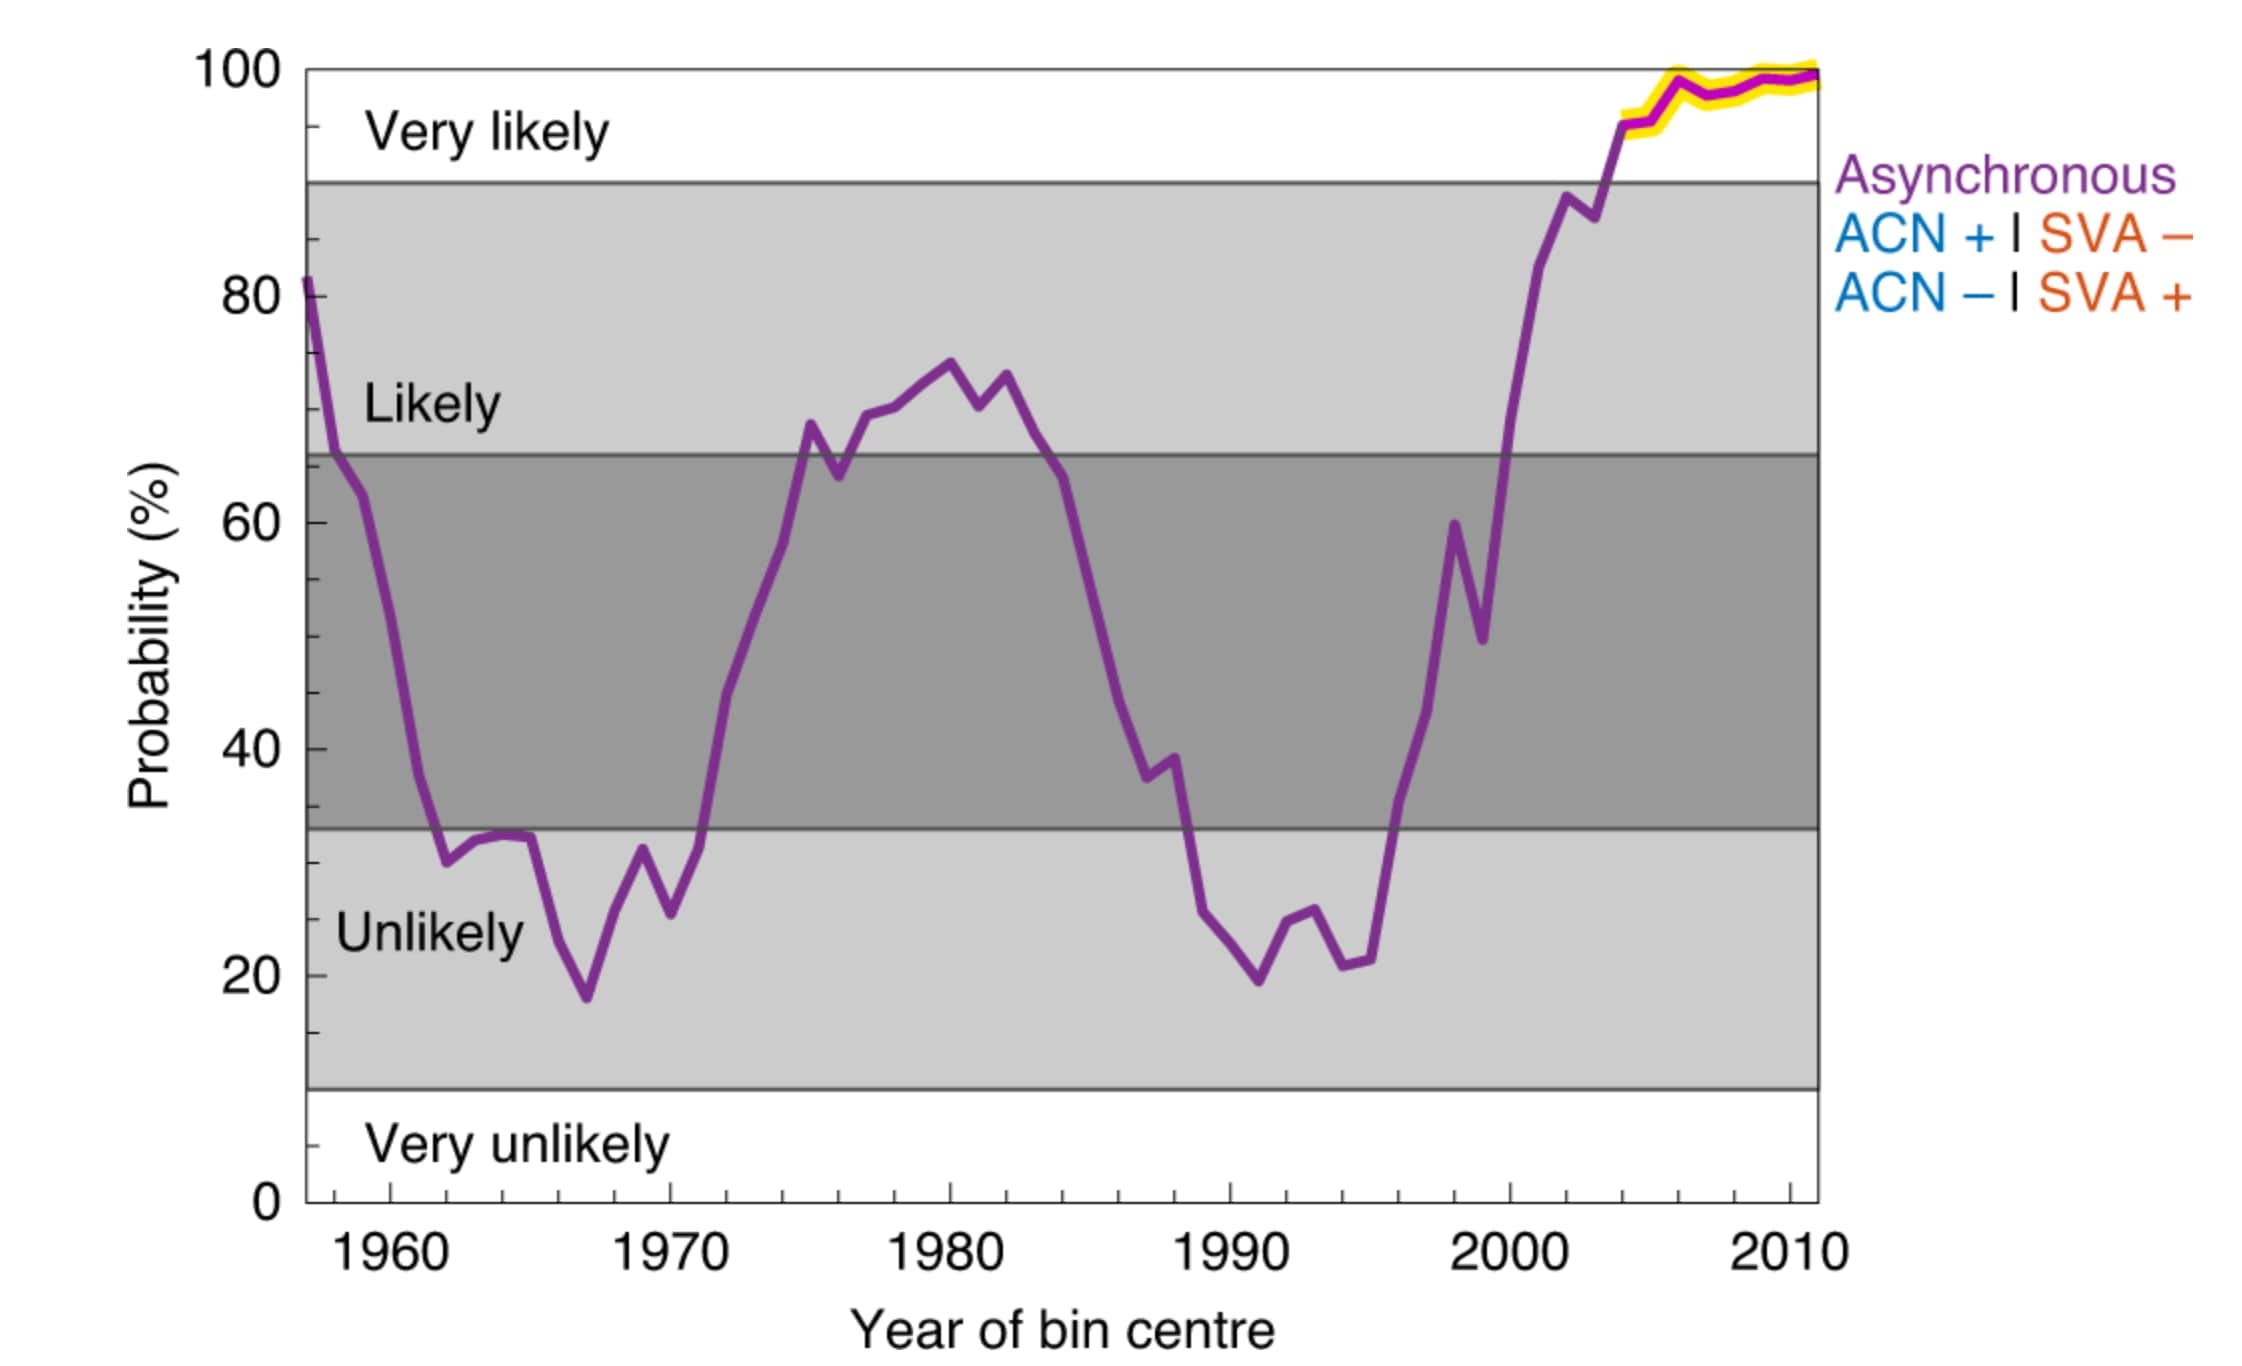
Figure 2: Likelihood over time that the Northern Canadian glaciers (ACN) experience a different air mass than the Svalbard glaciers (SVA) do [10].
This change of winds, recorded by the mass loss for the two glaciated regions is supported by many modeling studies predicting the consequences of anthropogenic global warming in the 21st century. As authors of this study, we can not predict what will happen in the future but want to highlight the importance of the ongoing efforts for monitoring and analysis of the Arctic cryosphere. We need satellites, meteorological stations and modeling works to be able to keep a close look at what is happening in the Arctic, or, to quote from The Scorpions, keep on “[…] listening to the wind of change.”
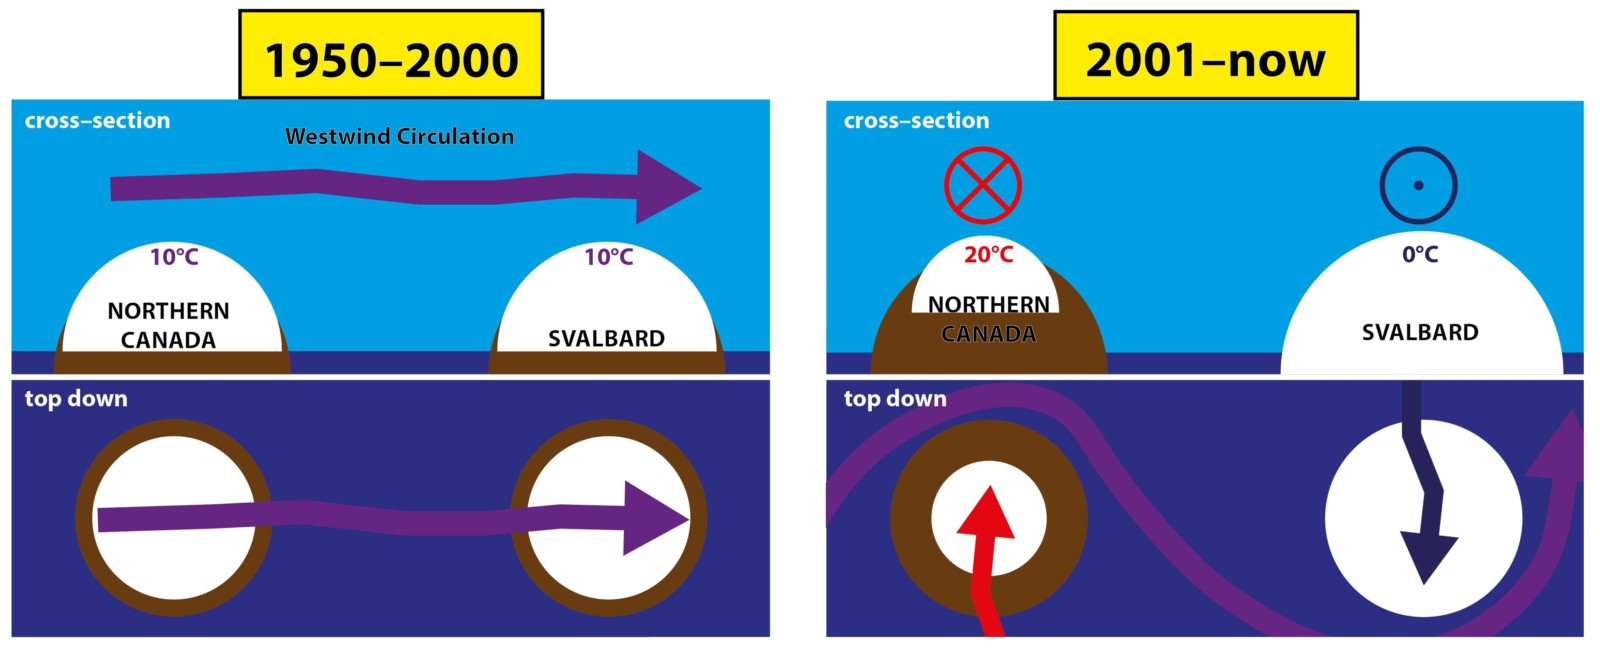
Figure 3: Schematic of the dominant wind circulation situation concerning the two glaciated regions for a) 1950–2000 and b) 2001–now.
This blog was edited by the editorial board.
References:[1] Hjort, J., Streletskiy, D., Doré, G., Wu, Q., Bjella, K. and Luoto, M., (2022) Impacts of permafrost degradation on infrastructure. Nature Reviews Earth & Environment, 3, 24-38, https://doi.org/10.1038/s43017-021-00247-8. [2] Stephen, K. (2018). Societal impacts of a rapidly changing Arctic. Current climate change reports, 4, 223-237, https://doi.org/10.1007/s40641-018-0106-1. [3] Box, J.E., Colgan, W.T., Wouters, B., Burgess, D.O., O’Neel, S., Thomson, L.I. and Mernild, S.H. (2018) Global sea-level contribution from Arctic land ice: 1971–2017. Environmental Research Letters, 13, 125012, https://doi.org/10.1088/1748-9326/aaf2ed. [4] Tan, Z. and Zhuang, Q. (2015) Arctic lakes are continuous methane sources to the atmosphere under warming conditions. Environmental Research Letters, 10, 054016, doi:10.1088/1748-9326/10/5/054016. [5] Sun, X., Ding, Q., Wang, S. Y. S., Topál, D., Li, Q., Castro, C., Teng, H., Luo, R. and Ding, Y. (2022) Enhanced jet stream waviness induced by suppressed tropical Pacific convection during boreal summer. Nature Communications, 13, 1-10, https://doi.org/10.1038/s41467-022-28911-7. [6] Smith, D.M., Eade, R., Andrews, M.B., Ayres, H., Clark, A., Chripko, S., Deser, C., Dunstone, N.J., García-Serrano, J., Gastineau, G. and Graff, L.S., (2022) Robust but weak winter atmospheric circulation response to future Arctic sea ice loss. Nature communications, 13, 1-15, https://doi.org/10.1038/s41467-022-28283-y. [7] Cohen, J., Zhang, X., Francis, J., Jung, T., Kwok, R., Overland, J., Ballinger, T.J., Bhatt, U.S., Chen, H.W., Coumou, D. and Feldstein, S. (2020) Divergent consensuses on Arctic amplification influence on midlatitude severe winter weather. Nature Climate Change, 10, 20-29, https://doi.org/10.1038/s41558-019-0662-y. [8] Coumou, D., Di Capua, G., Vavrus, S., Wang, L. and Wang, S. (2018) The influence of Arctic amplification on mid-latitude summer circulation. Nature Communications, 9, 1-12, https://doi.org/10.1038/s41467-018-05256-8. [9] Overland, J.E., Ballinger, T.J., Cohen, J., Francis, J.A., Hanna, E., Jaiser, R., Kim, B.M., Kim, S.J., Ukita, J., Vihma, T. and Wang, M. (2021) How do intermittency and simultaneous processes obfuscate the Arctic influence on midlatitude winter extreme weather events? Environmental Research Letters, 16, 043002, https://doi.org/10.1088/1748-9326/abdb5d. [10] Sasgen, I., Salles, A., Wegmann, M., Wouters, B., Fettweis, X., Noël, B.P. and Beck, C. (2022) Arctic glaciers record wavier circumpolar winds. Nature Climate Change, 12, 249-255, https://doi.org/10.1038/s41558-021-01275-4.