Today we will shed some light on permafrost thanks to Dr. Dmitry (Dima) Streletskiy.  Dima is an Assistant Professor of Geography and International Affairs at the George Washington University. He leads several research grants focusing on various aspects of climate change and its impacts on natural and human systems in the Arctic. Streletskiy is the President Elect of the United Sates Permafrost Association and the Chair of Global Terrestrial Network for Permafrost.
If you want to see some videos on the topic, feel free to check the following links:
Video on youtube from Siberia field class on permafrost and urban sustainability: https://youtu.be/ZlblSd4g4gE
Video on youtube from Alaska field work https://www.youtube.com/watch?v=LqYcOiCQOGk
Dima has also agreed on sharing some pictures collected during his research. So, if you are curious, just scroll to the bottom of the interview and enjoy the view!
Hello Dima, could you please briefly define what permafrost is for our audience?
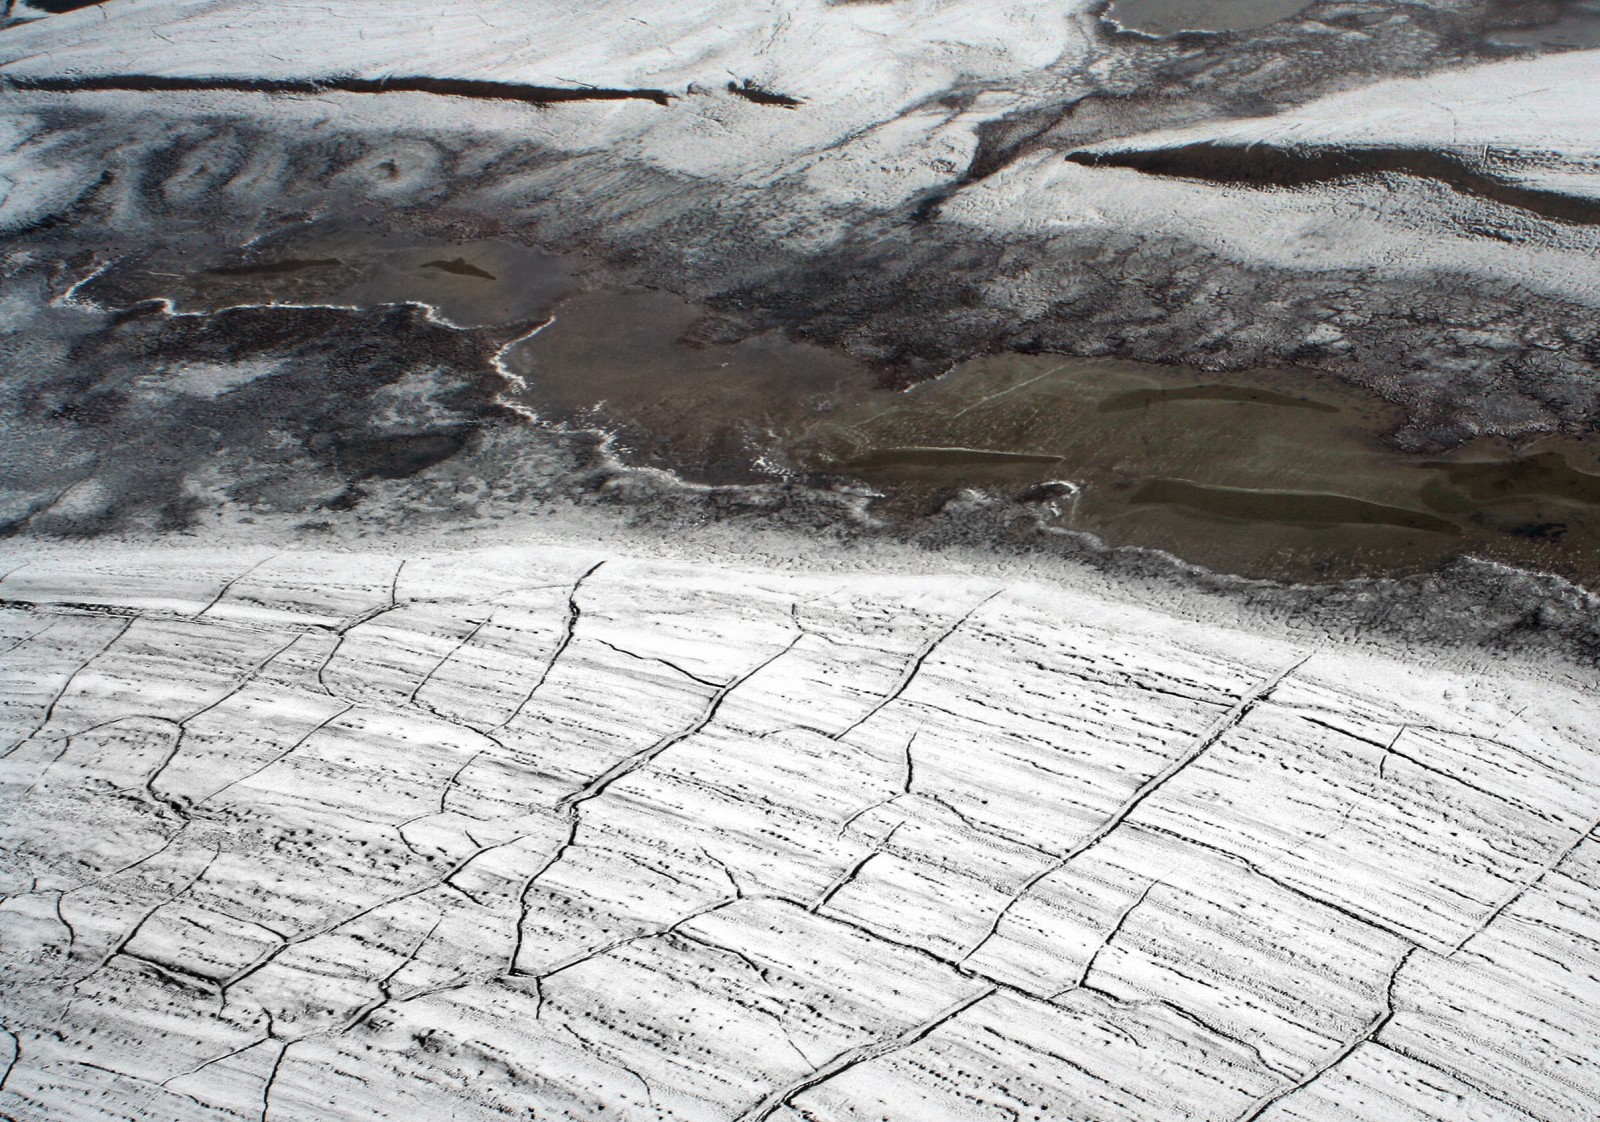
Permafrost plays an important role in global climate change, functioning of arctic ecosystems, and human activities in the cold regions. Permafrost is soil, rock, and any other subsurface earth material that exists at or below 0°C throughout at least two consecutive years, usually for decades up to millennia. Permafrost stands for perennially frozen ground (“existing more than two years”), not permanently frozen. I think that this is one of the major popular misconceptions about permafrost. Permafrost is not permanent and is a rather dynamic phenomenon, which makes it increasingly relevant in the context of natural hazards. Even more dynamic, is the active layer, the layer overlying the permafrost, which thaws during the summer and refreezes the following winter affecting many biological and hydrological processes in permafrost regions.
1 – Why is it an important topic and what is permafrost degradation?
Thermal conditions of permafrost and active layer processes are robust indicators of the state of the permafrost system under climate change. Following changing climatic conditions, permafrost temperature and active layer have increased in European, Russian and American Arctic over the last 30 years. The alpine regions are not exception; European Alps, Altay Mountains and Tibetan Plateau are all characterized by permafrost degradation. The latest global assessments show that with a notable exception of Antarctic, permafrost degradation is happening at a global scale. For example, locations along the southern permafrost boundary in the European North of Russia and Quebec report more than 50 km retreat of permafrost southern boundary.
Permafrost soils hold the largest terrestrial pool of organic carbon. Progressive thaw may enable this carbon to enter the biochemical cycles, which may reinforce the arctic warming and affect the global climate system at decadal to centennial time scale. More immediate effects of permafrost degradation are associated with changes in ecosystems as permafrost thaw may affect the topography and hydrologic regime. Permafrost and active layer characteristics are also essential in designing, building and maintaining infrastructure in cold regions, which makes permafrost an important consideration in economic development. This is concerning in the context of resource development of the Arctic regions, especially in Russia. Mountain permafrost regions may also experience decrease in slope stability and changes in hydrology as a result of permafrost degradation. Whether you are a tourist on a ski lift in the Swiss Alps, a passenger on train in Tibetan Plateau, or a shift worker in the Arctic Alaska, permafrost is there with you.
2 – Could you please tell us what makes the permafrost system unique?
I would not call permafrost unique. Permafrost is rather common phenomenon, because the regions in which it occurs occupy about a quarter of the Northern Hemisphere’s land surface.
3 – How does the community collect data on permafrost?
The Global Terrestrial Network for Permafrost (GTN-P: gtnp.arcticportal.org) provides systematic long-term measurements of permafrost temperature and active layer thickness (ALT). GTN-P was created in 1999 within the framework of the Global Climate Observing System/Global Terrestrial Observing System (GCOS/GTOS) in support of the United Nations Framework Convention on Climate Change (UNFCCC) as a network of permafrost observatories to obtain a set of standardized temperature measurements in all permafrost regions of the planet to provide a baseline for temperature change assessments and data for validation of climatic models.
Presently, the two major components of GTN-P are: long-term monitoring of the thermal state of permafrost in an extensive borehole network, the Thermal State of Permafrost – TSP ( www.permafrostwatch.org); and monitoring of the Active-layer thickness and dynamics – ALT, primarily through the efforts of the Circumpolar Active Layer Monitoring (CALM) programme (www.gwu.edu/~calm). These components have been implemented through partial networks coordinated by the International Permafrost Association (IPA) since their establishment.
The data collected in the field are publicly available through the GTN-P data management system (DMS: gtnpdatabase.org) which allows automatic data submission, standardization, quality control, processing, and data access and provides opportunity to evaluate spatial and temporal variability of permafrost temperature and ALT at various cold regions. Presently 1350 TSP boreholes and 250 active layer sites are registered in the DMS.
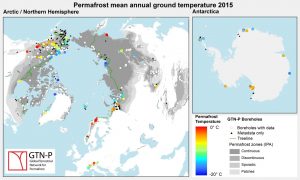
Global map of permafrost monitoring boreholes showing permafrost temperature at zero annual amplitude depth in 2010-2015 as reported by 314 sites (a); Map of the sites monitoring active layer thickness with data from 2016 as reported by 71 sites (b). (Source: Global Terrestrial Network for Permafrost GTN-P).

Location of the active layer monitoring sites contributing data to GTN-P. Active layer thickness is shown for 2015
4 – Could you summarize the main environmental factors that play a significant role on permafrost health?
Permafrost is a temperature dependent condition, so using thermometer to measure permafrost health makes a perfect sense. Permafrost temperature within the first few meters is affected by seasonal variations and is largely determined by climatic conditions of a given year, but deeper permafrost may reflect climatic conditions of hundreds and thousands of years. Permafrost scientists usually refer to the mean annual permafrost temperature at zero amplitude depth (the depth at which the effects of seasonal variability are negligible) to evaluate the “health” of the permafrost. This makes permafrost temperature a much better indicator of climate change than air temperature.
Increasing permafrost temperature usually suggestive of deteriorating health of the permafrost system. Following changing climatic conditions, permafrost temperature increase is a relatively fast process (should we call it permafrost fever?), but when temperature approaches the melting point, it may take substantial time to thaw completely, effectively putting permafrost in a prolonged coma state.
Besides permafrost temperature we want to know how deep is the active layer, and while it can be measured in various ways, the most common is related to changes in mechanical strength. Permafrost scientists use probe (graduated metal rod) which they insert into the soil till the point of resistance to infer the permafrost table. Things get more complicated in alpine terrain where mechanical probing method is not possible. In this case data from temperature boreholes are used to interpolate the deepest depth of penetration of zero degree isotherm interpreted as the maximum thaw. The third commonly used method is using thaw tubes. A rigid outer tube is anchored in permafrost, and serves as a vertically stable reference; an inner, flexible tube is filled with water or sand containing dye. The approximate position of the thawed active layer is indicated by the presence of ice in the tube, or by the boundary of the colourless sand that corresponds to the adjacent frozen soil.
The progressive increase in permafrost temperature and active layer thickness are indicative of permafrost degradation. While these characteristics are largely depend on the atmospheric temperature of particular year, changes in above-ground conditions, such as snow and vegetation may significantly affect permafrost system. Particularly changes in snow accumulation may have an effect the permafrost health. Snow is a very effective thermal insulator. Just like a blanket, it does not allow cold to penetrate to the ground. The projected increases in air temperature are generally associated with increases precipitation, which is primarily comes as a snow, so no god news for permafrost here. The active layer is probably in a better shape as it is mostly determined by the summer temperature conditions, which are expected to change, but not as drastically as conditions of cold season. Active layer thickness will increase following increases in summer temperatures, but increasing vegetation biomass (“greening”) may partially offset this trend.
5 – What are the consequences of permafrost degradation in the short, medium and long-term
Permafrost changes due to climate are exacerbated in areas of human and industrial activities as these are commonly associated with removal of organic and vegetation layers, snow redistribution and waterlogging. These human–induced changes making permafrost more vulnerable to rapidly warming climate and may result in the accelerated rates of permafrost degradation. Melting of ground ice negatively impacts sparse transportation network and decreases accessibility of remote northern or alpine communities. Increasing permafrost temperature results in decrease of ability of foundations on permafrost to support buildings and structures. The increasing number of buildings with structural deformations limits housing market stock and increases already high cost of living of communities on permafrost.
Increasing permafrost temperatures may also deteriorate food security of predominantly indigenous populations which traditionally rely on ice cellars dug into permafrost to store and preserve fish, poultry and meat. There is a growing concern that permafrost degradation may expose viruses and bacteria dormant in permafrost. Recent studies show that permafrost has large amount of mercury, which may further affect water quality and health. There is still lack of good understanding on occurrence and frequency of “permafrost craters” and potential hazards associated with those landforms, especially in areas of intense economic development.
The longer term impacts associated with changing hydrologic conditions (drying in southern permafrost regions and waterlogging in northern), potential changes in increase in discharge of the Arctic rivers, and accelerated rates of coastal erosion, especially under continuous decline in sea ice extent. Long-term changes are associated with thawing of ice-rich permafrost, resulting in ground subsidence which may lead to inundation of coastal areas, which may result in loss of habitats, and change in biochemical cycles.
Permafrost soils hold more organic carbon than any other soils. Subsea permafrost also caps substantial amounts of methane, which may be released under progressive increase as the Arctic Ocean temperatures continue to increase. While carbon in permafrost is an important topic, it traditionally receives most of the attention, so I intentionally ignored it to showcase more immediate impacts of permafrost degradation, which commonly forgotten behind the role of permafrost in biochemical cycles. Instead, I refer the reader to the excellent source of latest research is Permafrost Carbon Network (www.permafrostcarbon.org).
Picture/figure collection
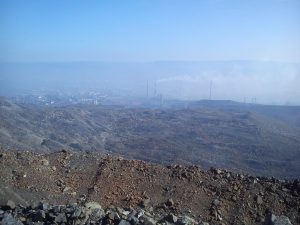
The slope stability is likely to decrease as a result of permafrost warming. This may further affect mining towns surrounded by tailing. The largest man-made rock glacier, Norilsk, Russia (photo by Dmitry Streletskiy, July 2012)
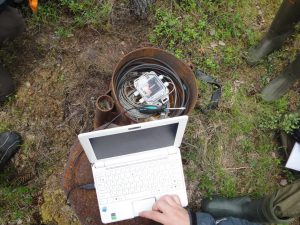
Permafrost temperature monitoring borehole near Igarka. In this pretty standard example, the temperature monitoring is conducted by the array of four thermistors (1.0, 2.5, 5.0, 10 m) connected to a data logger. This setup allows collecting hourly data on permafrost temperature over the two years period. Every two years data are downloaded and battery is replaced (photo by Dmitry Streletskiy, July 2011)
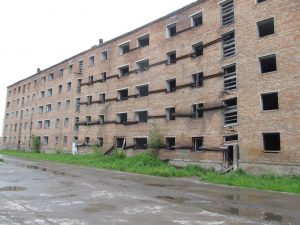
Structural deformation of building on permafrost due to loss of the foundation bearing capacity, Igarka, Russia (photo by Dmitry Streletskiy, July 2012)
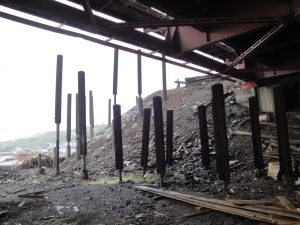
The thermosyphons can be an effective in mitigation of negative impacts of climate warming or landuse on permafrost, but are relatively expensive. The example of successful stabilization of the frozen bank of the river in order to preserve the bridge near Norilsk, Russia (photo by Dmitry Streletskiy, July, 2011).
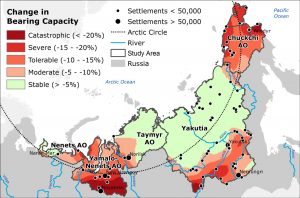
Relative changes in bearing capacity from 1965-1975 to 2000-2010 estimated using permafrost geotechnical model by Streletskiy et al., 2012. (Based on the NCEP Climate Data)
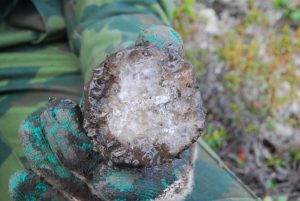
Ground ice at 3 m depth, Igarka, Russia (photo by Dmitry Streletskiy, July 2011)