The Sun is an active radio emitter, it produces radio emissions in a wide frequency range from kHz to THz. The solar atmosphere has a complex distribution of magnetic field, plasma density, and temperature. These different properties of the solar atmosphere will result in different radio emission features at different frequencies. In principle, the plasma density decreases with the heliocentric distance, and higher density plasma tends to generate higher frequency radio emissions, thus the features in lower frequency correspond to the higher altitude regions in the solar atmosphere. Observations in solar low-frequency emission can help diagnose the plasma property at high altitudes in the solar atmosphere.
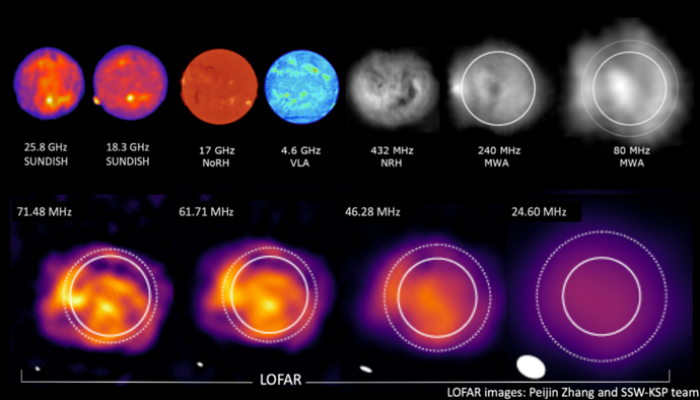
In recent work (Imaging of the Quiet Sun in the Frequency Range of 20-80 MHz – Arxiv-2205.00065), we performed an observation on the quiet Sun in the frequency range of 20-80 MHz with the Low-Frequency Array, in which we achieved an unprecedented spatial resolution of quiet Sun in decameter-wave.
What can we see?
With calibrated imaging of the quiet Sun, we can obtain the brightness temperature of several frequency bands with high spatial resolution.
Frequency dependence of the brightness temperature
The first thing we did was to extend the Tb(f) curve (the brightness temperature & frequency relation), to compensate for the lack of the low-frequency brightness temperature measurements in the literature.
![Figure 1. The brightness temperature spectrum observed by LOFAR (red), the modeled brightness temperature (solid black), and the previous observations [3-8].](https://blogs.egu.eu/divisions/st/files/2022/05/zhang_blog_fig1.png)
Figure 1. The brightness temperature spectrum observed by LOFAR (red), the modeled brightness temperature (solid black), and the previous observations [3-8].
The size of the Sun
We can also measure the size of the Sun from the high-resolution imaging, as shown in Figure 2, the size of the Sun decreases with frequency and can be 2.5 times the optical angular size of the Sun near 20 MHz. The size in the east-west direction is significantly larger than in the north-south direction, this shows the density and temperature difference near the equator and polar region.
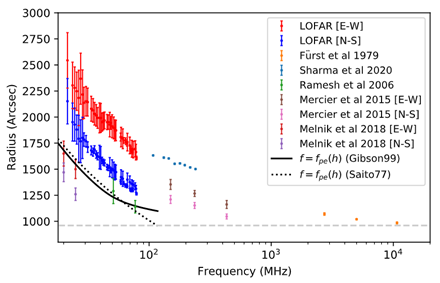
Figure 2, the size of the sun in different frequencies observed by LOFAR (red and blue), and previous observations.
Spatial distribution of brightness temperature
With high spatial resolution, we see the dramatic change of brightness temperature within small regions of the Sun, marked as blue and green in Figure 3, this implies a large gradient of temperature, plasma density or optical depth difference in the solar atmosphere.
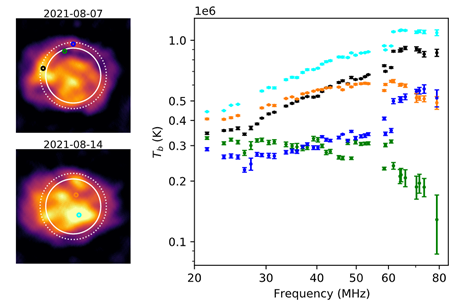
Figure 3 the brightness temperature spectrum of a few selected locations.
How did we achieve it?
A large number of antennas in LOFAR-LBA provided the elementary spatial resolution and sensitivity, we use 24 core stations and 9 remote stations, giving the longest baseline of 48km. We used Cassiopeia-A to perform calibration to obtain the precise brightness temperature. The image is produced with a time integral of 2.45h to increase the signal-to-noise ratio and average out the ionosphere fluctuations.
What’s next
In the future, with the implementation of LOFAR 2.0, there will be upgrades in both hardware and software, the new timing system using a fiber-optic network connecting all Dutch stations of LOFAR will make it easier to calibrate and produce high fidelity imaging, With the potential upgrade to dual-beam antennas and using the current upgrade in the computational power of the correlator COBALT 2.0 we will gain more observing flexibility, making LOFAR capable of carrying out simultaneous observations for several science cases, including Solar and Space Weather study as a Key Science Project. We can now already perform multi-mode observations on the Sun to have a high spatial resolution on the imaging features with interferometry observation of Core+Remote stations, and also high time and frequency resolution on the radio transients in the solar activities with beamformed observation with Core-only stations.
With the high spatial resolution interferometry, we can inspect the outer solar atmosphere structures. The high time and frequency resolution beamformed observation can help us trace the electron beams accelerated in the solar eruption activities, revealing the energy transforming process in the solar atmosphere.
Reference
[1] Zirin, H., Baumert, B., & Hurford, G. 1991, The Astrophysical Journal, 370, 779
[2] Selhorst, C., Silva, A., & Costa, J. 2005, Astronomy & Astrophysics, 433, 365
[3] Sharma, R., & Oberoi, D. 2020, The Astrophysical Journal, 903, 126
[4] Subramanian, K. 2004, Astronomy & Astrophysics, 426, 329
[5] Ramesh, R., Nataraj, H., Kathiravan, C., & Sastry, C. V. 2006, The Astrophysical Journal, 648, 70
[6] Mercier, C., & Chambe, G. 2015, Astronomy & Astrophysics, 583, A101
[7] Melnik, V., Shepelev, V., Poedts, S., et al. 2018, Solar Physics, 293, 1
[8] Sharma, R., & Oberoi, D. 2020, The Astrophysical Journal, 903, 126