You thought that Mauna Loa was the only observatory to provide continuous measurements of atmospheric carbon dioxide concentration and were disappointed because Hawaii is way too far from your study area or because you wanted to know how bad the air is in your hometown? The US have been monitoring the composition of the atmosphere since 1972, but what about Europe? Since 2008, Europe has its own measurement network that is managed by a research infrastructure called ICOS (Integrated Carbon Observation System).
Context
Since the beginning of the industrial era (around 1750), atmospheric concentrations of greenhouse gases such as carbon dioxide (CO2), methane (CH4) and nitrous oxide (N2O) have increased, mostly because of human activities. As a consequence, the climate is getting warmer, which could have dramatic impacts on our daily life. The evolution of the atmospheric composition should therefore be closely monitored.
To improve our understanding of the climate system and achieve good climate predictions, high-precision measurements of greenhouse gas sources and sinks are needed. A large amount of datasets already exists, but the problem is that these data are often too difficult to access, too scattered, not consistent or not reliable.
ICOS main objectives
This is why the main goal of ICOS is to provide scientists, citizens and decision makers with harmonized and high-quality measurements of greenhouse gases in Europe. But the scope of ICOS mission is wider because these data can further be used to:
- quantify greenhouse gas budgets
- improve climate predictions
- check how well/badly European countries are doing in reducing their greenhouse gas emissions
- adapt policies
ICOS also encompasses an educational dimension by training young scientists through summer schools, workshops and conferences and by spreading knowledge about the carbon cycle to the general public.
Network
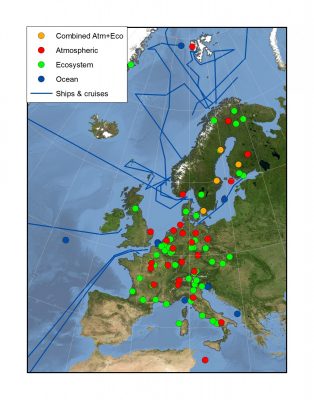
ICOS is subdivided in national networks managed by research institutes. Twelve countries are currently members of ICOS: Belgium, Czech Republic, Denmark, Finland, France, Germany, Italy, Netherlands, Norway, Sweden, United Kingdom and Switzerland. The regional dynamics of greenhouse gases is monitored thanks to a network of 126 measurement stations implemented across these countries. Among these stations, 71 are ecosystem stations, 34 are atmospheric stations and 21 are ocean stations (Figure 1). ICOS grows rapidly and 8 other countries are expected to become members soon: Poland, Ireland, Estonia, Portugal, Spain, Hungary, Greece and South Africa.
To be part of the ICOS standardized network, candidate sites have to follow strict specifications regarding equipment, measurement protocols and data processing in order to ensure a homogeneous dataset. Periodic measurements are also carried out across the network with independent instruments to limit systematic errors. Moreover, ICOS is planning to render its data products compatible with outputs from other international measurement networks by taking part in an intercomparison program.
Atmosphere stations (Figure 2)
Atmospheric CO2, CO and CH4 concentrations are continuously measured in atmosphere stations, together with a range of usual meteorological variables such as air temperature, atmospheric pressure, relative humidity, wind direction and speed.
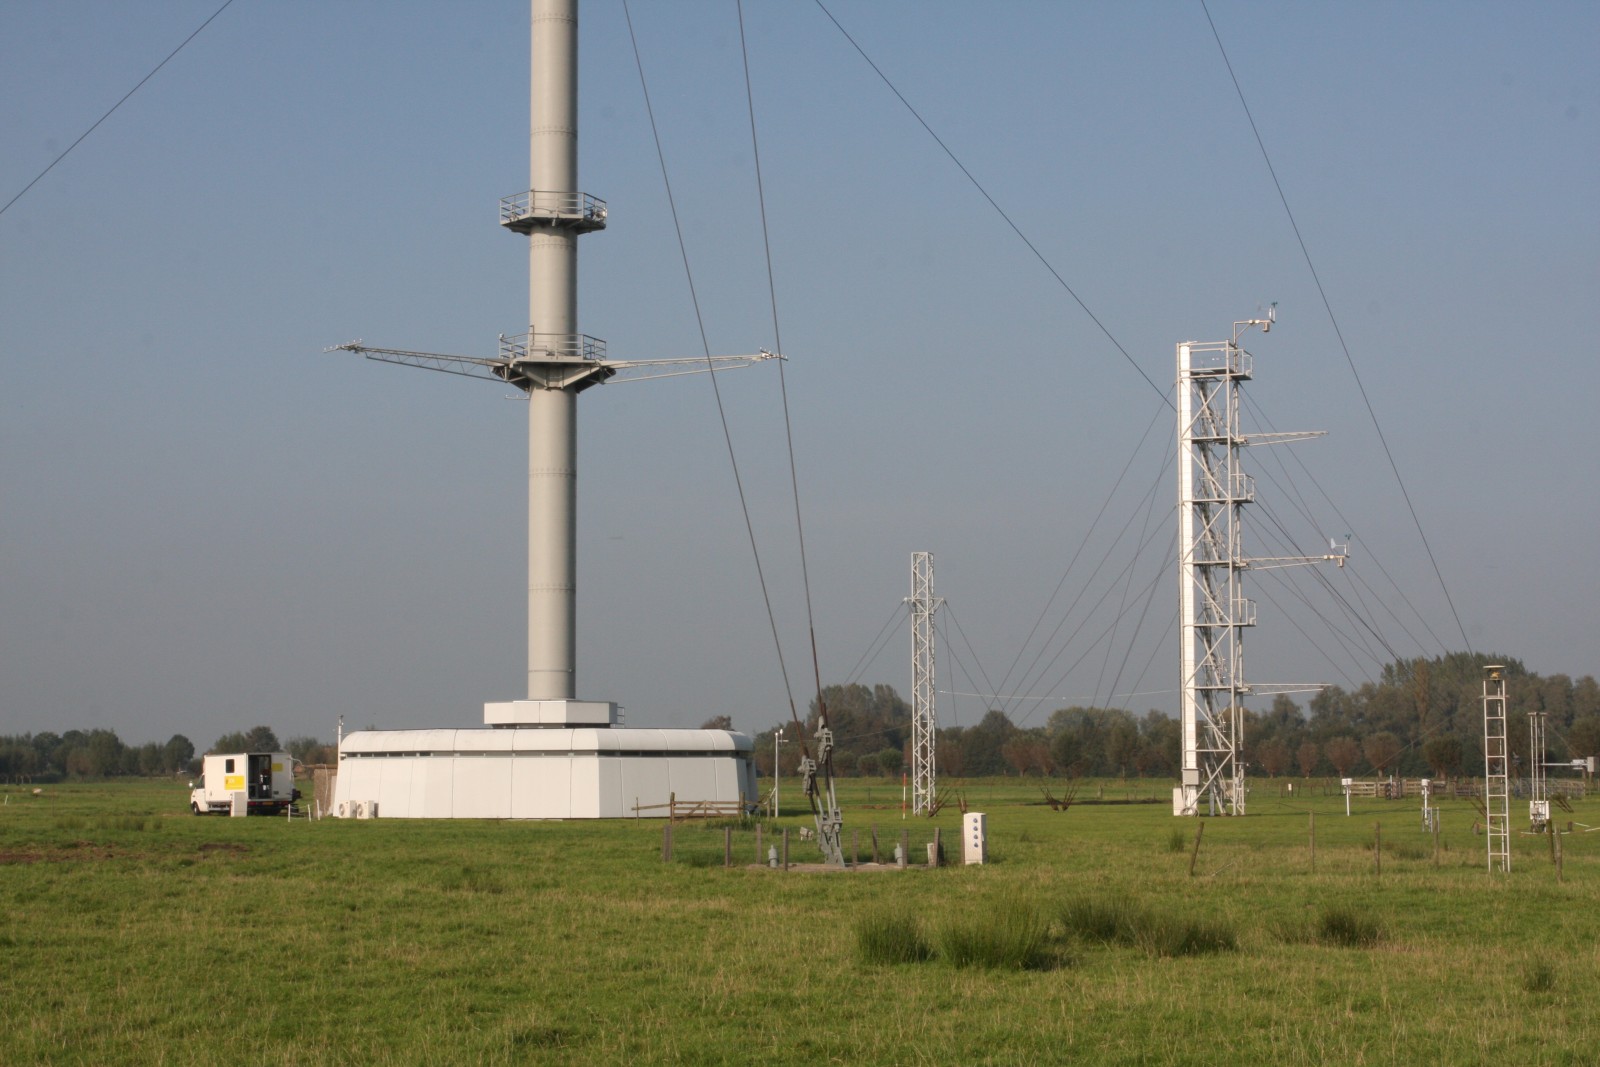
Figure 2: Cabauw atmosphere station in the Netherlands (ICOS ERIC, https://meta.icos-cp.eu/labeling/)
Ecosystem stations (Figure 3)
Flux towers measure the exchange of water vapour, greenhouse gases and energy between the different types of ecosystems and the atmosphere. The list of variables collected at ecosystem stations is available here.
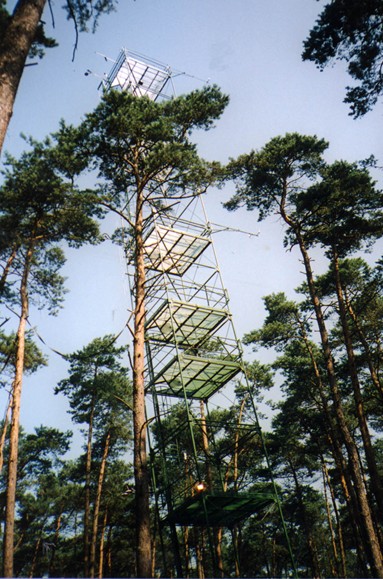
Figure 3: Brasschaat ecosystem station in Belgium (ICOS ERIC, http://www.icos-belgium.be/inf_ecosystem.html)
Ocean stations (Figure 4)
Ocean stations include ships, fixed buoys and flux towers. Carbon fluxes are measured at the ocean-atmosphere interface together with other marine variables such as pH, temperature, or salinity. You can have a look at the exhaustive list of measurements here.

Figure 4: VLIZ data buoy ocean station (ICOS ERIC, https://www.icos-ri.eu/sites/default/files/2017-07/ICOS_Belgium_Media_Kit_EN_0.pdf)
Data products
Data collected by national network stations are gathered, processed and stored by central facilities called Thematic Centers (TC): the Atmosphere Thematic Center (ATC), the Ocean Thematic Center (OTC) and the Ecosystem Thematic Center (ETC).
You can access all these precious data for free here on the carbon portal. Among many examples, you can find ecosystem fluxes time series, atmospheric methane observations or global carbon budget. It is easy to handle as you can apply filters to refine your search, click on the “eye” icon to preview the data, or just select the dataset to obtain its description.
These data are protected by a Creative Commons Attribution 4.0 international licence, which means you can share and even modify them provided that you document any change, mention the original data source and give a link to the licence text (https://data.icos-cp.eu/licence). It is of course necessary to cite ICOS when you use the data. To make this as easy as possible, the citation is provided when you download the data set.
On the website of the Atmosphere Thematic Center, you can also find near real time data that are computed from all ICOS atmospheric stations every day in the morning. For example, Figures 5 and 6 show time series of the fraction of CO2 (top plot) and CH4 (bottom plot) in the air mass coming from the European continent measured at Mace Head station (MHD). Depending on the wind direction, this atmospheric station, located on the west coast of Ireland, is exposed to either the North Atlantic Ocean air mass and or the European continental air mass, offering a unique way to study these very different air masses. Time series for the period 2011-2017 show a clear upward trend for both greenhouse gases in the continental air mass. These increases are mainly caused by growing emissions associated to human activities.
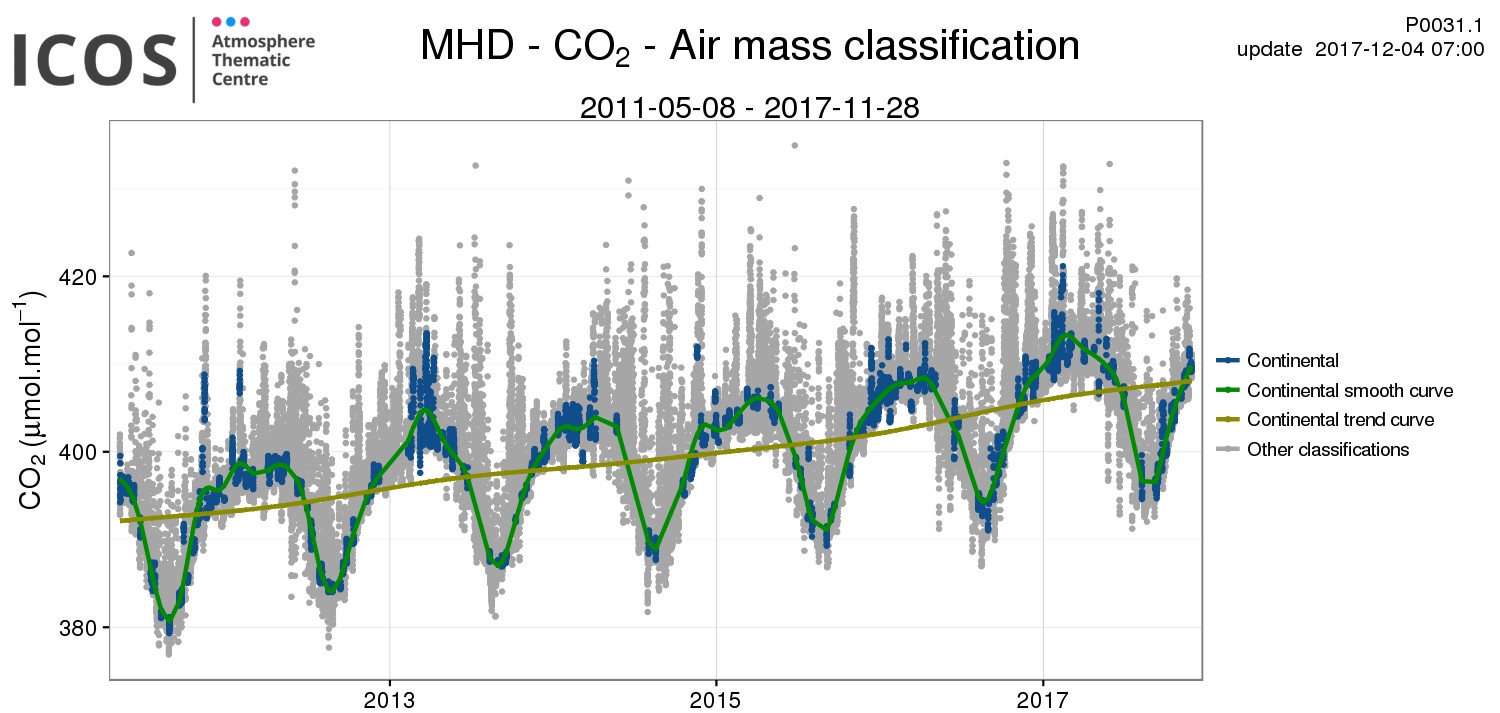
Figure 5: CO2 molar fraction in continental air mass between 2011 and 2017 at Mace Head atmospheric station (ICOS ERIC, https://icos-atc.lsce.ipsl.fr/P0031.1)
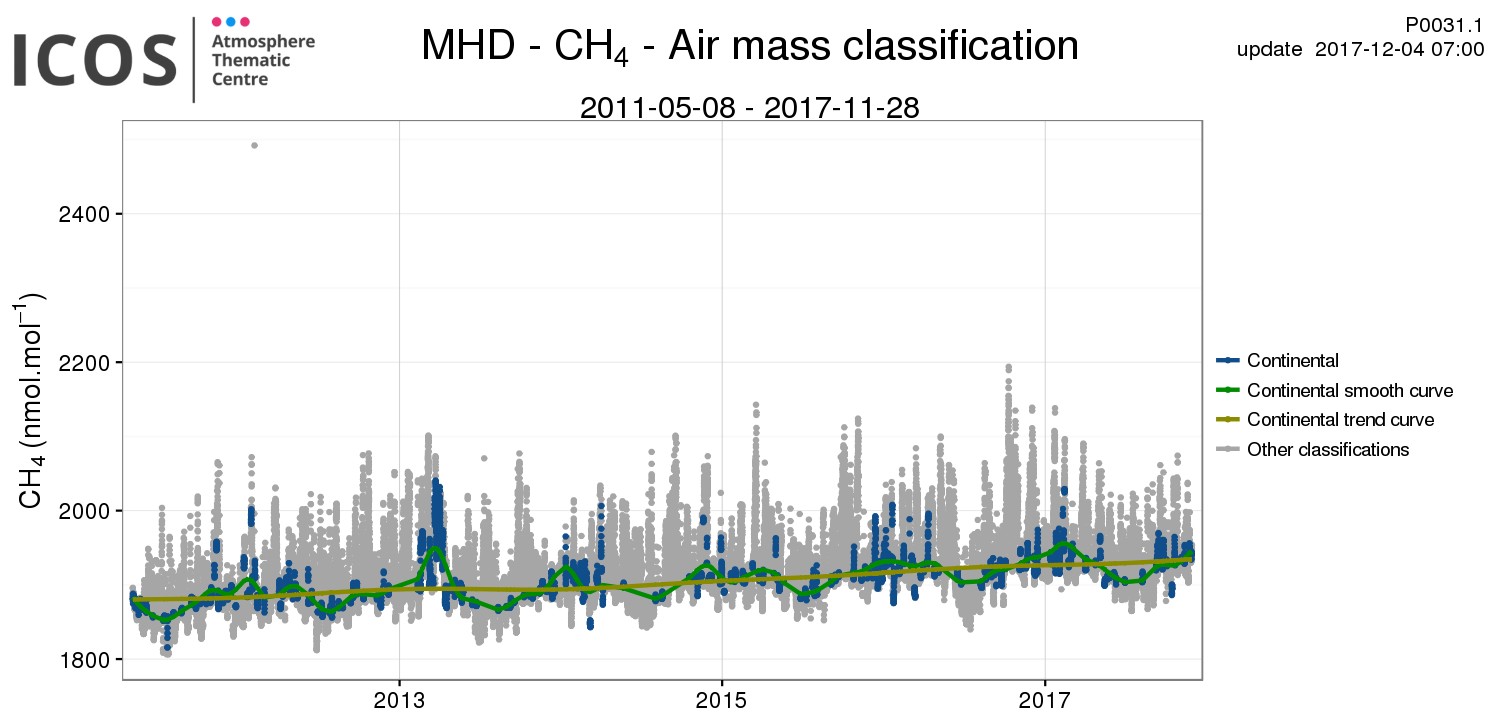
Figure 6: CH4 molar fraction in continental air mass between 2011 and 2017 at Mace Head atmospheric station (ICOS ERIC, https://icos-atc.lsce.ipsl.fr/P0031.1)
Hopefully, this post helped you to get to know ICOS better. Do not hesitate to use this great tool in the future!
Find out more about ICOS
For those interested, the 3rd ICOS Science Conference will take place between the 11th and the 13th of September 2018 in Prague, Czech Republic.
Edited by Gabriele Messori and Célia Sapart