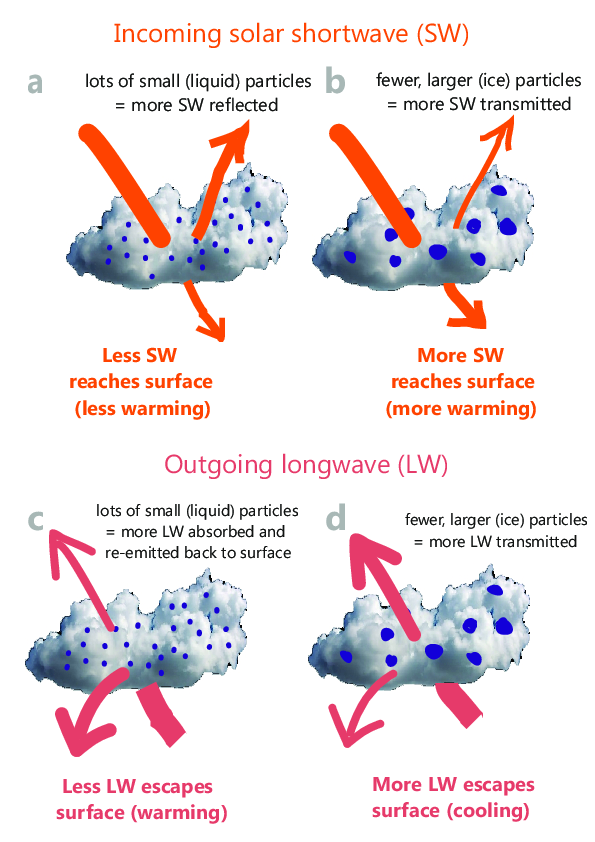
Schematic showing the effects of cloud microphysics on the radiative properties of clouds for shortwave solar radiation (a & b) and longwave terrestrial radiation (c & d) [Credit: Ella Gilbert].
The Antarctic Peninsula is the ‘canary in the coalmine’ of Antarctic climate change. In the last half-century it has warmed faster than most other places on Earth, and considerable change has consequently been observed in the cryosphere, with several ice shelves collapsing in part or in full. Representing this change in models is difficult because we understand comparatively little about the effect of atmospheric processes on melting in Antarctica, especially clouds, which are the main protagonists of this Image of the Week…
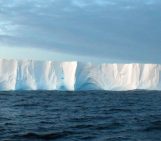
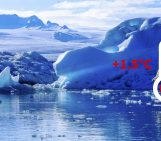
The Antarctic Peninsula: a part of the southern continent that is surrounded by ice shelves, but also a place that has seen rapid and dramatic changes in the last decades. Until recently, the Antarctic Peninsula was one of the most rapidly warming regions on Earth, with annual mean surface temperatures rising by as much as 2.5°C between the 1950s and early 2000s in some places (Turner et al., 2005; 2016).
That warming has been linked to the demise of the region’s ice shelves: since 1947, more than half of the peninsula’s ice shelves have thinned, lost area, or collapsed entirely (Cook & Vaughan, 2010). Most recently, that includes Larsen C, whose area was reduced by 12% in July 2017 following a calving event where an iceberg four times the size of London broke away from the ice shelf. As a result, the ice shelf has slipped down the rankings from the 4th largest ice shelf on the continent to the 5th largest.
What makes ice shelves melt?
Evidence suggests that ice shelves on the peninsula are being warmed mostly from the top down by the atmosphere. This is contrary to what’s happening on other Antarctic ice shelves, like those in West Antarctica that are being eroded from beneath by the warming ocean. Atmospheric processes are much more important over peninsula ice shelves than those elsewhere on the continent.
To understand the effect of the atmosphere on melting at the top of ice shelves, we need to know how much energy is entering the surface of the ice shelf, how much is leaving, and use what’s left over to determine whether there’s residual energy available to melt the ice. That’s the general principle of the surface energy balance, and it’s called a ‘balance’ because it is usually just that – the amount of energy flowing into and out of the ice shelf averages out over the course of say, a year, to produce a net zero sum of energy left for melting. However, there are times when this balance can become either negative, leading to growth of the ice shelf, or positive, leading to ice loss via melting.
What affects the surface energy balance?
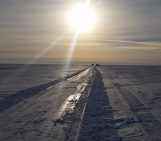
Many different processes influence the surface energy balance, such as weather patterns and atmospheric motion. For instance, when warm, dry air blows over an ice surface, which happens during ‘foehn‘ wind events (German readers will know this means ‘hairdryer’: a descriptive name for the phenomenon!), this can produce a surplus of energy available for melting (Grosvenor et al., 2014; King et al., 2017; Kuipers Munneke et al., 2018). If the surface temperature reaches 0°C, melting occurs.
What do clouds have to do with it?
Clouds also greatly influence the surface energy balance by affecting the amount of radiation that reaches the surface. The amount of incoming solar (shortwave) radiation that reaches the surface, and the amount of terrestrial (longwave) radiation that escapes is affected by what stands in the way – clouds. Of course, this obstacle is important for the surface energy balance because it affects the balance between the energy flowing into and out of the surface. However, the fine-scale characteristics of clouds (aka ‘microphysics’) produce different, often interacting and sometimes competing, effects on the surface energy balance, some of which are shown in the schematic above. Examples of these properties include:
- Water phase (how much ice and liquid there is)
- Number concentration (how many particles)
- Particle size
- Ice crystal shape
The amount of ice and liquid in a cloud can affect how much energy it absorbs, reflects and emits – for instance, the more liquid a cloud contains, the more energy it emits towards the surface, because it is thicker and tends to be warmer than a cloud with lots of ice. However, clouds made up of lots of tiny liquid droplets also tend to be brighter than ice clouds containing larger crystals, which means they reflect more incoming solar radiation back into space. This example is a typical one where different microphysical properties cause competing effects, which makes them difficult to separate from each other.
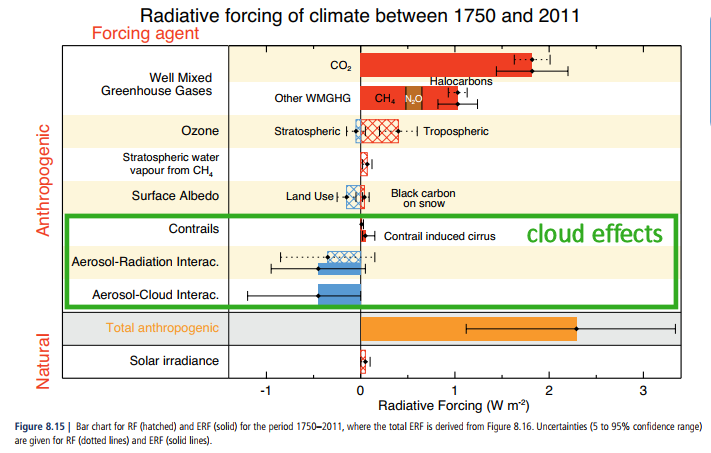
Radiative forcing (RF, solid bars) and Effective radiative forcing (ERF, hatched bars) of climate change during the Industrial Era (1750-2011) [Credit: adapted from IPCC Fifth Assessment Report, Figure 8.15: pp. 697].
What do we know about Antarctic clouds?
The short answer is: not that much. Clouds are the largest source of uncertainty in our estimates of global climate change (check out the huge range of error in the estimates of cloud-driven radiative forcing in the figure above, from the IPCC’s most recent report), and the science of Antarctic clouds is even more unclear because we don’t have a great deal of data to base our understanding on. To measure clouds directly, we need to fly through them – a costly and potentially dangerous exercise, especially in Antarctica.

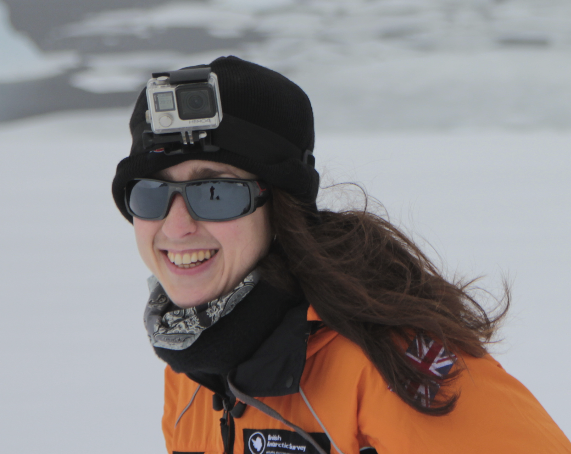
Flying through a gap in cloud near Jenny Island on the approach to Rothera research station, on the Antarctic Peninsula, at the end of a data collection flight in November 2017 [Credit: Ella Gilbert].
Filling the gap
In somewhere like Antarctica where we don’t have much observational data, we have to rely on other tools. That’s where computer models can be really useful – so long as we can be confident in the results they produce. Unfortunately, that’s part of the problem. Cloud properties and their effects on the surface energy balance are complex: we know that much. But modelling those properties is even more complex, because we have to simplify things to be able to turn them into computer code.
There is hope though! Recent studies (e.g. Listowski et al., 2017) have shown that models can more realistically represent Antarctic cloud microphysics if they use more sophisticated ‘double moment’ schemes, which are able to simulate more microphysical properties. With more accurate microphysics comes better representation of the surface energy balance, and improved estimates of melt over Antarctic ice shelves.
Further reading
- On the effect of foehn on wintertime melting over Larsen C:
Kuipers Munneke, P., Luckman, A. J., Bevan, S. L., Gilbert, E., Smeets, C. J. P. P., Van Den Broeke, M. R., Wang, W., Zender, C., Hubbard, B., Ashmore, D., Orr, A. King, J. C. (2018). Intense winter surface melt on an Antarctic ice shelf. Geophysical Research Letters 45, 7615–7623. doi:10.1029/2018GL077899
- On clouds in Antarctica:
Lachlan-Cope, T. (2010). Antarctic clouds. Polar Research 29 (2), 150–158. doi:10.1111/j.1751-8369.2010.00148.x
- On modelling cloud microphysics over the Antarctic Peninsula:
Listowski, C., & Lachlan-Cope, T. (2017). The Microphysics of Clouds over the Antarctic Peninsula – Part 2: modelling aspects within Polar WRF. Atmospheric Chemistry and Physics 17, 10195-10221. doi:10.5194/acp-17-10195-2017
- Check out Ella’s website and YouTube channel about atmospheric science over Larsen C, and follow her on Twitter: @Dr_Gilbz
Edited by Clara Burgard
 Ella Gilbert is a PhD student at the British Antarctic Survey, where she uses climate modelling and observational data to understand the drivers of melt on the Larsen C ice shelf. She’s a big fan of clouds, polar science, and science communication. You can find her on Twitter @Dr_Gilbz, on her website www.larsenc.com, or the old fashioned way by email.