the Creative Commons Attribution 4.0 License.
the Creative Commons Attribution 4.0 License.
 | 27 Apr 2018
Adaption of an array spectroradiometer for total ozone column retrieval using direct solar irradiance measurements in the UV spectral range
Ralf Zuber
Peter Sperfeld
Stefan Riechelmann
Saulius Nevas
Meelis Sildoja
Gunther Seckmeyer
A compact array spectroradiometer that enables precise and robust measurements of solar UV spectral direct irradiance is presented. We show that this instrument can retrieve total ozone column (TOC) accurately. The internal stray light, which is often the limiting factor for measurements in the UV spectral range and increases the uncertainty for TOC analysis, is physically reduced so that no other stray-light reduction methods, such as mathematical corrections, are necessary. The instrument has been extensively characterised at the Physikalisch-Technische Bundesanstalt (PTB) in Germany. During an international total ozone measurement intercomparison at the Izaña Atmospheric Observatory in Tenerife, the high-quality applicability of the instrument was verified with measurements of the direct solar irradiance and subsequent TOC evaluations based on the spectral data measured between 12 and 30 September 2016. The results showed deviations of the TOC of less than 1.5 % from most other instruments in most situations and not exceeding 3 % from established TOC measurement systems such as Dobson or Brewer.
- Article
(1636 KB) - Full-text XML
- BibTeX
- EndNote


Many applications in the ultraviolet spectral range cannot be addressed with array spectroradiometers since they are often limited by internal stray-light effects (Egli et al., 2016). An example is an accurate measurement of solar irradiance in the UV-B spectral range. The intense radiation of the sun in the visible (VIS) and infrared (IR) generates stray light within the spectrometer, which often dominates over the less intense solar UV-B radiation. However, an accurate measurement of solar spectrum (Seckmeyer et al., 2001, 2010) is the basis for an accurate evaluation of many derived quantities such as total ozone column (TOC; Dobson, 1931; Mayer and Seckmeyer, 1998). Hence, these measurements are often performed with double-monochromator-based systems (Hülsen et al., 2016), offering high stray-light reduction capabilities. Operating such instruments is often time- and cost-intensive and requires controlled ambient conditions and highly experienced personnel.
To overcome such limitations, Gigahertz-Optik GmbH developed the BTS2048-UV-S series array spectroradiometer. The system conjoins compact instrument design, a physical-filter-based stray-light correction and versatile radiometric applicability. One of the newly developed devices has been adapted specifically for direct solar irradiance measurements and was extensively characterised at the Physikalisch-Technische Bundesanstalt (PTB) in Germany. It then took part in the ATMOZ intercomparison campaign in Izaña, Tenerife, in 2016 in the framework of the European Metrology Research Programme (EMRP) project ENV59 ATMOZ – a total ozone measurement intercomparison organised by the Izaña Atmospheric Research Center of the Spanish Meteorological Agency (AEMET) and the World Radiation Center (PMOD-WRC), where new instruments and techniques developed within the project were compared to well-established Dobson and Brewer methods.
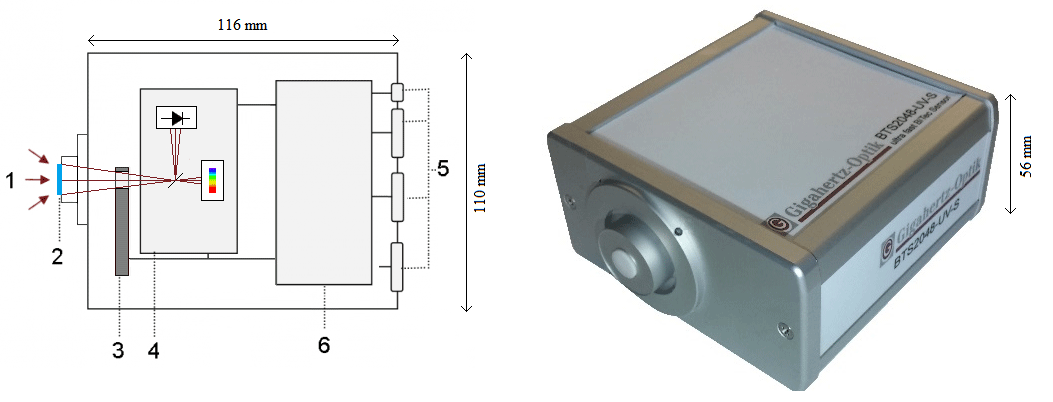
Figure 1Schematical setup of the BTS2048-UV-S and photo of the instrument. (1) Incoming optical radiation, (2) direct entrance port with cosine diffuser, (3) filter wheel, (4) sensor system, (5) electrical connectors, (6) microprocessor for data processing and communication.
The BTS2048-UV-S series array spectroradiometers developed and manufactured by Gigahertz-Optik GmbH are based on the well-known Czerny–Turner (Shafer et al., 1964) spectrometer design. The spectrometer uses a temperature-controlled (8 ∘C) back-thinned Hamamatsu CCD detector with 2048 pixels and an electronic shutter integrated in a compact optical bench with 16 bit analogue–digital converter (ADC) resolution. Integration times from 2 µs up to 60 s provide a high dynamic range of the instrument in the spectral range from 200 to 430 nm. The detector unit is complemented with a silicon carbide (SiC) photodiode to enable fast time-resolved radiometric measurements.
To enable stray-light-corrected measurements, a miniaturised filter wheel with up to six different optical filters is integrated into the optical path between the entrance optic and spectrometer unit (Fig. 1). A set of selected optical filters, such as bandpass- and edge-type filters, can be used to preselect the radiation entering the sensor system. In the device one long-pass filter, a bandpass filter (298 to 390 nm) and four interference filters (centre wavelength: 254, 285, 300 and 400 nm) are integrated, which sufficiently block in the whole remaining spectral responsivity range of the detector. Hence, several sub-measurements with different filters in the optical path can be performed. The combination of these sub-measurements allows for optimised stray-light-reduced spectra. In addition, multiple different combinations of filters, integration times and sub-measurements optimise the measurement scenario to any kind of specific radiometric application. For instance, a so-called out-of-range (OoR) stray-light correction method has been implemented, where an additional measurement with a long-pass filter is performed to quantify contribution of the out-of-range stray light to the measured signal, which can then be subtracted. In order to perform reliable solar UV measurements, a specific measurement scenario, the so-called solar bandpass correction method, was used. This measurement scenario is based on a series of measurements with several narrow-bandpass filters which complement each other (Shaw and Goodman, 2008). Hence, the overall measurement time to get a full spectral measurement is the sum of all integration times of the sub-measurements. Typically this measurement time is in the range of a few seconds, depending on the light source to measure. This active stray-light correction process is a straightforward alternative to mathematical stray-light correction methods that have been established for array spectroradiometers (Zong et al., 2006; Nevas et al., 2012). In some cases, e.g. when silicon (Si) detectors are used solely in the UV spectral range, the introduced technology can reduce the stray light more efficiently. The mathematical stray-light correction methods are based on a precise characterisation of the optical imaging performance with so-called line spread functions (LSFs). These functions should be determined at each detection wavelength of the spectroradiometer. This so-called in-range stray light can be corrected to improve the measurement threshold by about 2 orders of magnitude (Zong et al., 2006). However, this correction method is not able to correct for so-called out-of-range stray light that is generated in spectral intervals outside the spectroradiometer range where the detector used is still sensitive. If, for instance, a Si-detector-based spectroradiometer is designed for the spectral range from 200 to 400 nm, the in-range stray light can only be corrected for this spectral range. However, the Si detector itself is radiation-sensitive up to 1100 nm, and stray light originating from this out-of-range spectral region cannot be characterised with LSFs. This limitation might be resolved by measuring the responsivity of the spectroradiometer to the radiation at OoR wavelength using a calibrated detector or an additional spectroradiometer with extended wavelength range, for Si ideally up to 1100 nm (Nevas et al., 2014). However, such a correction method requires knowledge about the OoR spectrum not only during instrument calibration, which generally is readily available from the standard lamp calibration data, but also for the radiant sources under investigation, e.g. the direct solar irradiance, which may not be available for practical reasons. Hence, the presented optical-filter-based stray-light correction technology of the BTS2048-UV-S series offers an attractive alternative, especially in the UV range.
At PTB, several instrument parameters have been characterised to verify the quality and measurement capability of the BTS2048-UV-S. The wavelength calibration was performed with the help of wavelength-tuneable laser systems and checked using mercury pen lamps. The uncertainty for the wavelength calibration was found to be better than 0.1 nm. For measurements of solar irradiance however, the wavelength scale was additionally adapted with standard deviations (SDs) better than 0.02 nm to the solar Fraunhofer lines using the MatShic algorithm (Egli et al., 2014). The spectral bandpass was determined using LSFs measured with tuneable laser systems (Nevas et al., 2014). The bandpass function appears to be nearly symmetrical below 360 nm with an average bandwidth of 0.6 nm, full width at half-maximum (FWHM) (see Fig. 2).
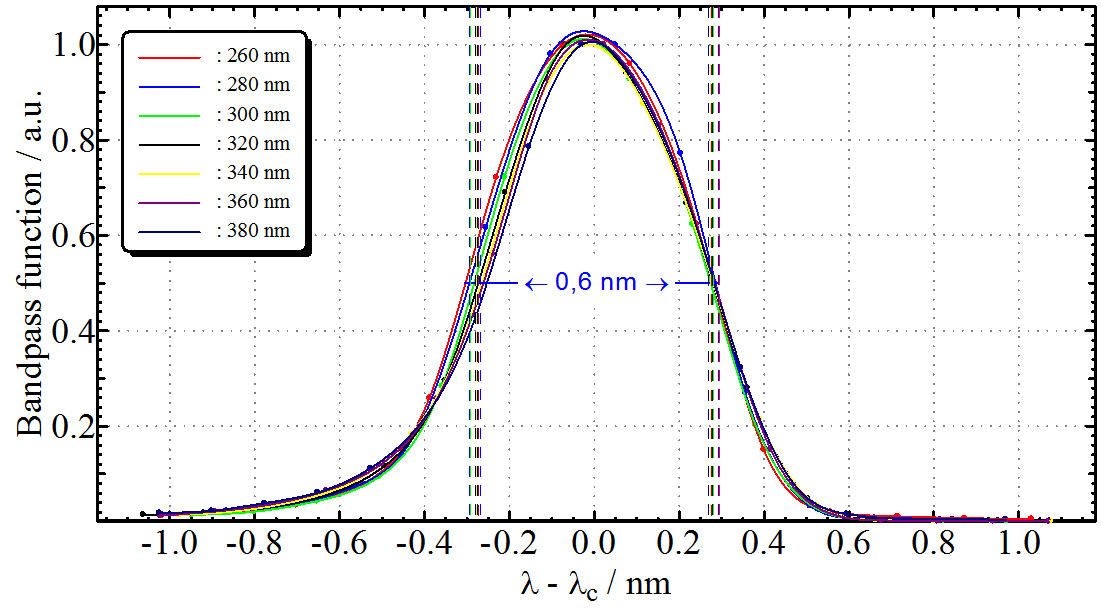
Figure 2Bandpass function around centroid λc for different wavelengths with bandwidth (FWHM, dashed lines) indicated.
The linearity of the BTS2048-UV-S was tested using both the integration time and the irradiance variation methods (Pulli et al. 2017). For the integration time method, the spectral irradiance of the incident radiation is kept constant while the instrument's integration time is varied over a wide range. Although the measurement signal in raw counts then varies with the integration time, the normalised count rates per second should remain constant for all measurements. The irradiance variation is performed at constant integration times of the instrument, while the irradiance is linearly reduced between each measurement. Here the ratio of measurement signal (count rate) and spectral irradiance should remain constant for all measurements. By applying a mathematical correction for non-linearity, the spectrometer showed linearity with a deviation smaller than 1 % over the full dynamic range for the characterised measurement mode. For spectral measurements the instrument saturation level is kept below 80 % to operate the instrument in an optimum between saturation and linearity. By using the solar bandpass-filter method, with adapted spectral integration times for each sub-measurement, the dynamic range of the instrument could be extended. Whenever the non-linearity exceeds 1 % (at very low signals), a non-linearity correction is automatically applied.
The instrument has been radiometrically calibrated using 250 W halogen lamps and 30 W deuterium lamps as transfer standards to perform spectral irradiance measurements traceable to the PTB (Sperfeld et al., 2010). In the overlapping spectral region of the two different lamp types between 280 and 360 nm the calibration matches well within the achieved measurement uncertainties. This demonstrates the good linearity and stray-light suppression capability of the instrument. Although these standard lamps required a comparably long integration time, due to a high dynamic range of the instrument (typically to 5×10⁴ W (m2 nm)−1 at 300 nm) it was possible to perform reliable measurements with very short integration times on high-power UV sources, such as medium-pressure mercury lamps, without the need for an additional attenuation.
The standard lamps used allow recalibration of the instrument in the laboratory and in the field. The resulting expanded measurement uncertainty (k=2) was estimated as 2.5 % in the short wavelength range. The uncertainty contributions are listed in Table 1 (see also Vaskuri et al., 2018).
Table 1Measurement uncertainties for the spectral irradiance measurement.
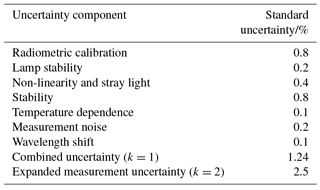
During the measurement campaign, described below, the radiometric calibration of the BTS2048-UV-S could be verified with a SD of less than 1 % compared to the calibrations in the laboratory before and after the campaign. During the campaign, the instrument was removed from the tracker at night to perform calibration measurements on a portable optical bench.
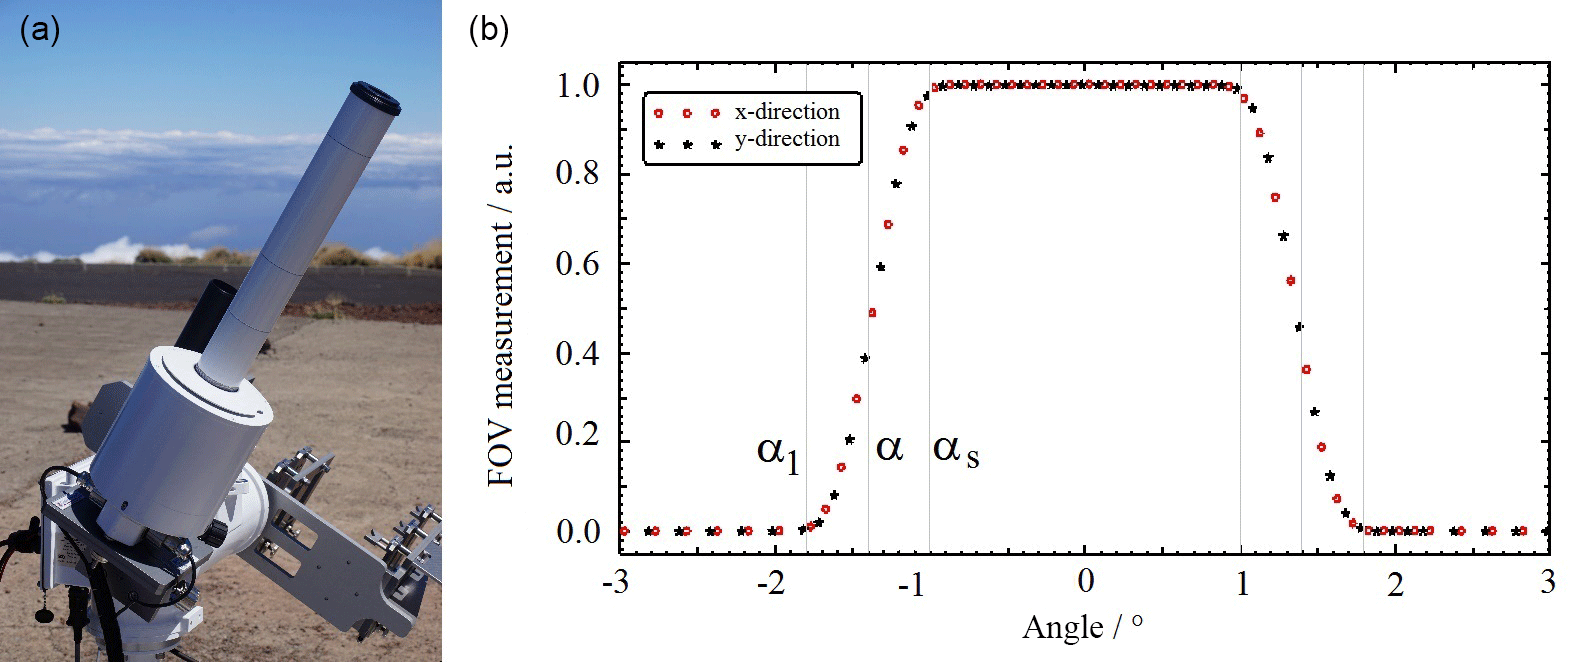
Figure 3(a) The BTS2048-UV-S-WP modified for direct solar measurements mounted on a solar tracker at the Izaña Atmospheric Observatory in Tenerife. (b) Field-of-view (FOV) measurement in x and y direction for the entrance optics tube according to Blanc et al. (2014). αs=1∘ represents the slope angle, αl=1.8∘ the limiting angle and α=1.4∘ the half opening angle. The full opening angle results in ∘.
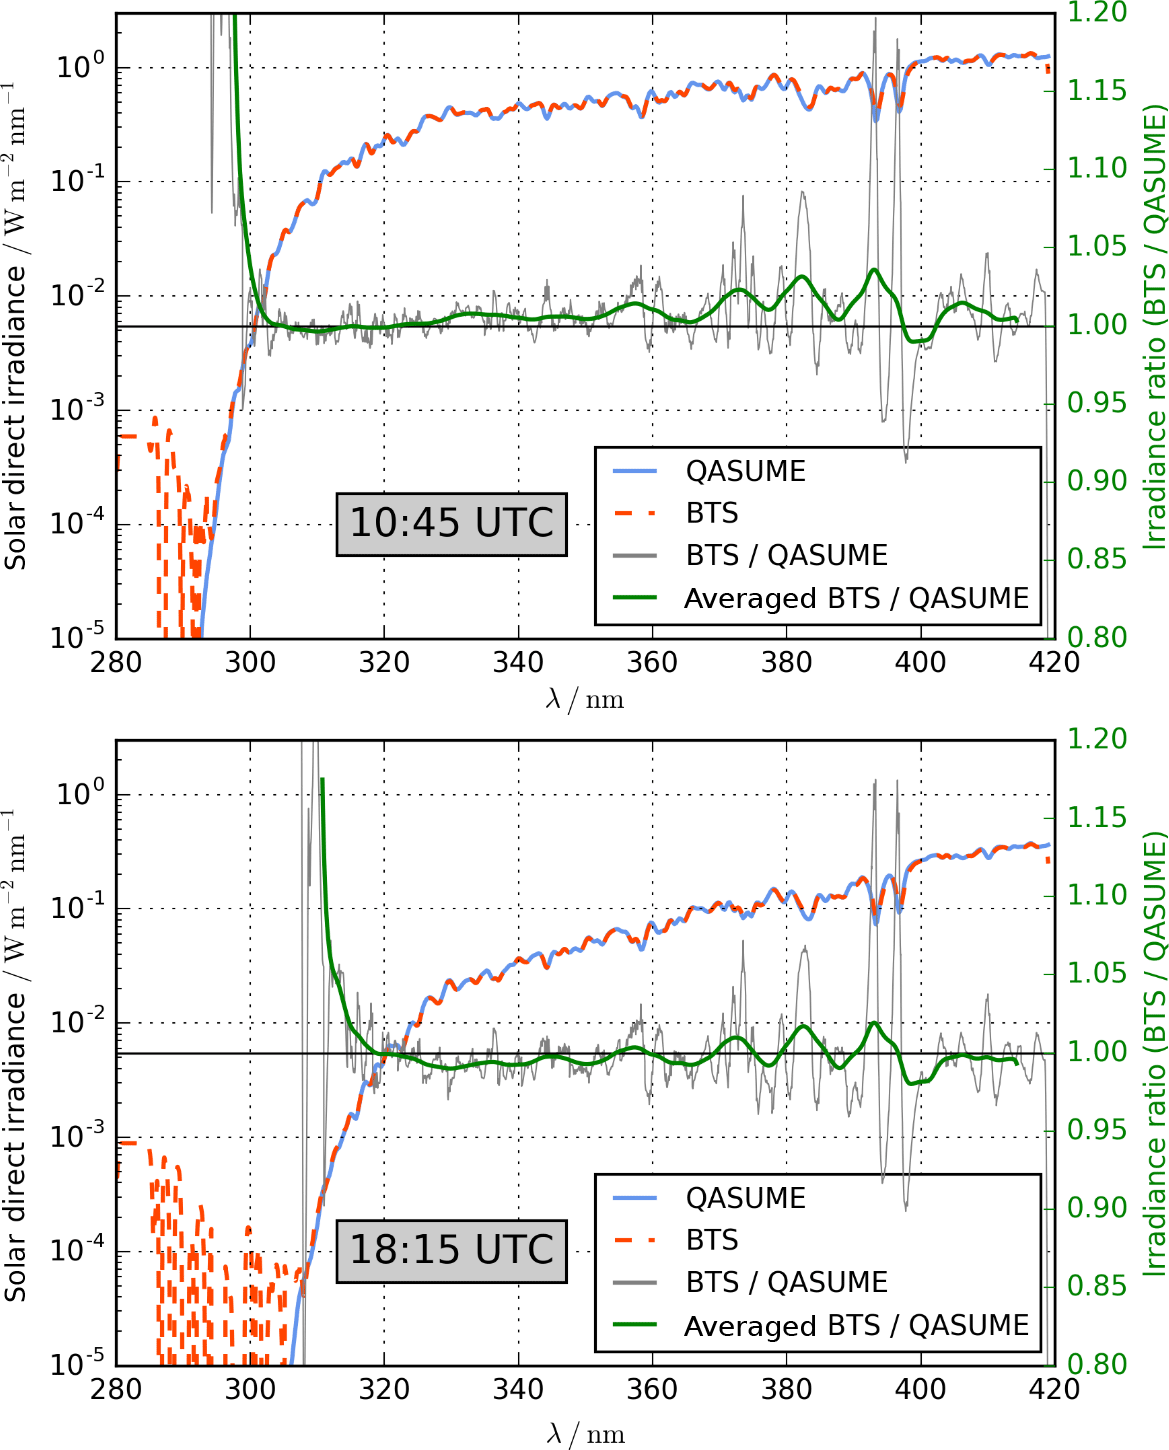
Figure 4Direct spectral irradiance (blue and red line) measured by the BTS and the double-monochromator-based QASUME instrument in Izaña on 20 September, at 10:45 UTC and 18:15 UTC. The ratio (grey line for single data and green line for moving average) of measurements (right axis) shows satisfactory agreement with average deviations of less than 2.5 % between 300 and 420 nm for low solar zenith angles at around noontime. The unaveraged ratio (grey line) can be explained by remaining small differences in the optical bandwidth in combination with small wavelength shifts. Due to non-averaging of the BTS data and limited integration time (measurement every 8 s), noise of the 16 bit ADC in the spectral region below the UV-B solar edge can be observed.
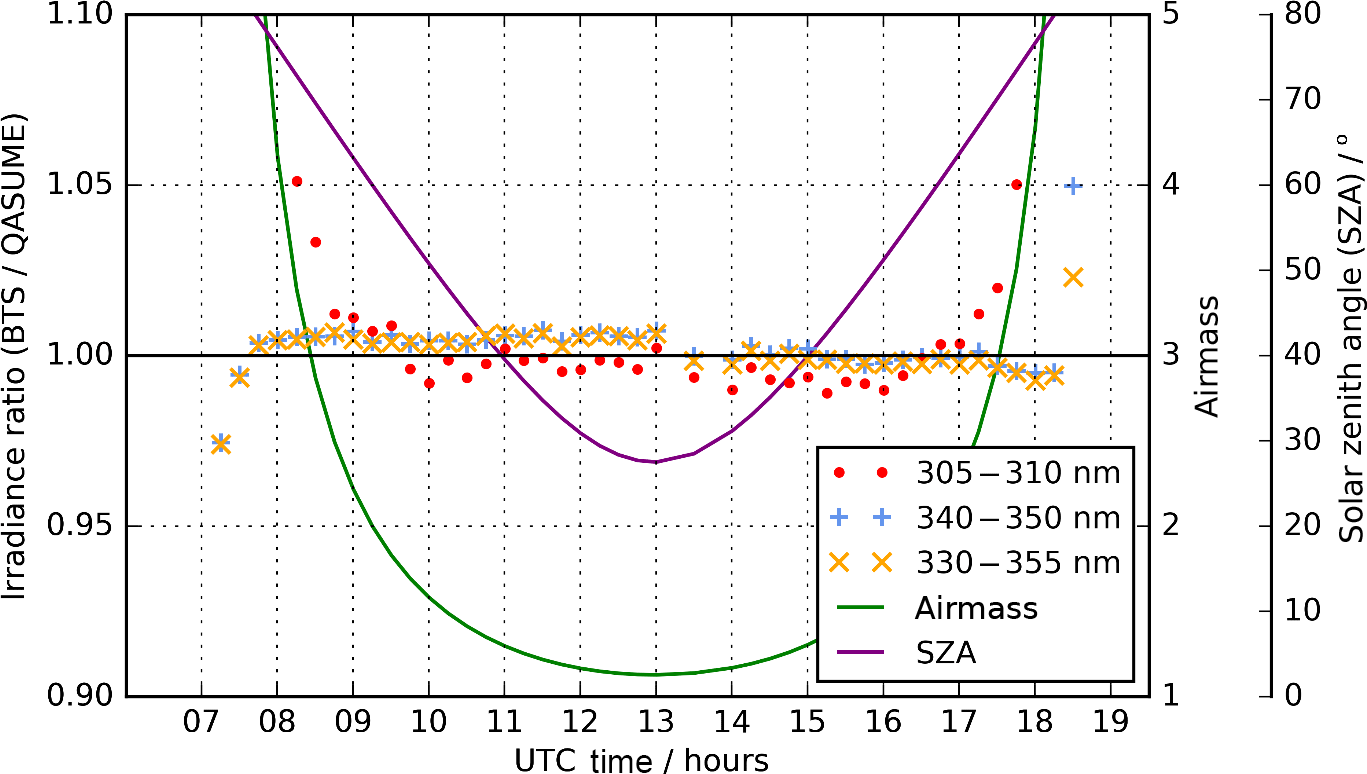
Figure 5BTS∕QASUME ratio of the wavebands used for the calculation of TOC values. The measurements were performed on 20 September 2016. The corresponding air mass of the direct irradiance and the solar zenith angle on the corresponding day are also shown (right axis). For solar zenith angles of more than 74∘ or an air mass above 3.6, deviations rise to 5 %.
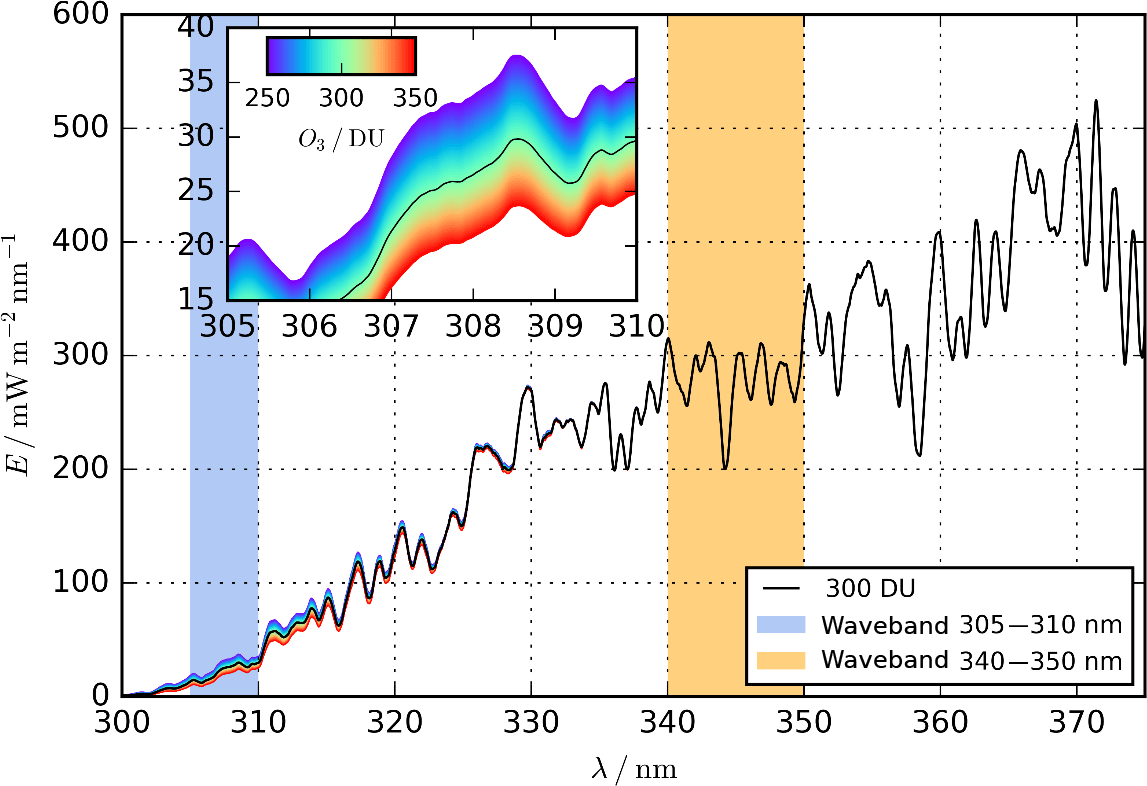
Figure 6Direct irradiance spectra of the lookup table modelled with libRadtran. Shown are all spectra for an SZA of 48∘, ranging from 250 (purple) to 320 DU (red) TOC. The wavebands used for the TOC retrieval are marked blue and orange.
4.1 Intercomparison of spectroradiometric measurements
For outdoor measurements of direct solar irradiance, a weatherproof (BTS2048-UV-S-WP) version of the BTS2048-UV-S was constructed. The instrument was integrated in a weatherproof housing which is temperature-controlled (ambient temperature range from −25 to +50 ∘C) and waterproof. During the 3-week measurement campaign in September 2016 at the Izaña Atmospheric Observatory (altitude: 2.373 m; coordinates: 28∘18′32 N, 16∘30′58 W), the typical temperature variation within the housing was below 0.1 ∘C (measured close to the spectrometer unit, with temperature set to 38 ∘C). There was cloudless sky during the measurements from which data have been used for this intercomparison. The housing was equipped with an entrance optic tube to limit the field of view to 2.8∘ (full opening angle; see Fig. 3). This tube is based on a baffle design to prevent stray light hitting the diffusor. Mounted on a solar tracker (EKO STR-32G) with a pointing accuracy of <0.01∘, the instrument measured direct solar irradiance. Solar measurements were performed using the solar bandpass correction method. Here, several narrow-bandpass filters are used in the spectral range between 280 and 420 nm. The single sub-measurements for every filter at varying integration times are subtracted by their assigned dark measurements with closed shutter and combined in their overlap region to one measurement of the full spectral range. This allows the steep slope of the solar spectrum to be measured below 300 nm with a high dynamic range (see Fig. 4). A full spectrum was recorded every 8 s. The duration of this measurement interval is mainly given by filter movement and dark-signal measurements, whereas the integration time for the measurements with different bandpass filters was optimised and varied with different solar zenith angles (SZAs). These settings allowed measurements with noise-equivalent irradiance in the range of 10−4 W (m2 nm)−1 (see Fig. 4).
The measurements were compared to the results of the double-monochromator-based Quality Assurance of Solar Spectral Ultraviolet Irradiance Measurements carried out in Europe (QASUME) instrument, which is extensively characterised for global irradiance (Gröbner and Sperfeld, 2005, Gröbner et al., 2005; Hülsen et al., 2016). For this intercomparison the QASUME instrument was equipped with a collimator-based entrance optic for direct solar irradiance measurements with a maximum field of view of 2.5∘ (full opening angle; Gröbner et al., 2017). To be able to compare two sets of data, the measured spectra of both instruments had to be synchronised in time and adapted in bandwidth. The QASUME system operates in sequential mode, measuring step by step from lower to higher wavelength. The recording of a full spectrum from 290 to 500 nm in steps of 0.25 nm takes about 16 min. Every measurement at a single wavelength is marked with a time stamp so that the corresponding measurement and the wavelength of the BTS2048-UV-S-WP (from now on called BTS) could be synchronised. As both spectroradiometer systems possess different bandwidth, the resulting spectra were convolved with a standard 1 nm triangular bandpass function. This data evaluation results in deviations between BTS and QASUME lower than ±2.5 % averaged from 300 to 420 nm (see Fig. 4).
The diurnal variation between QASUME and BTS of different waveband ratios shows deviations of less than ±2 %. The ratios rise for SZAs larger than 74∘ or an air mass larger than 3.6 (Fig. 5). At higher SZAs or air mass the signal-to-noise ratio decreases, especially at low wavelengths, due to the increasing atmospheric absorption path of the incident irradiance.
4.2 Intercomparison of TOC values
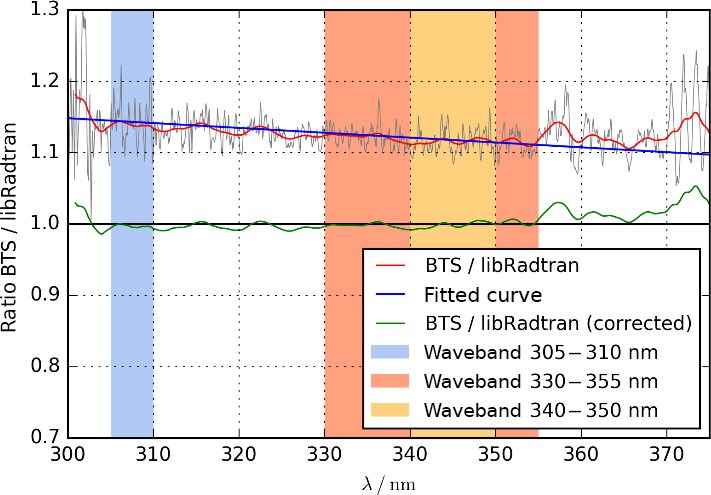
Figure 7Example of the atmospheric correction applied to a TOC calculation of BTS data on 20 September 2016, 10:06 UTC. The waveband ranging from 330 to 355 nm was used to derive the slope of the blue fitting line. The green line is the ratio of a BTS measurement and a libRadtran calculation after subtracting the blue fitting line.
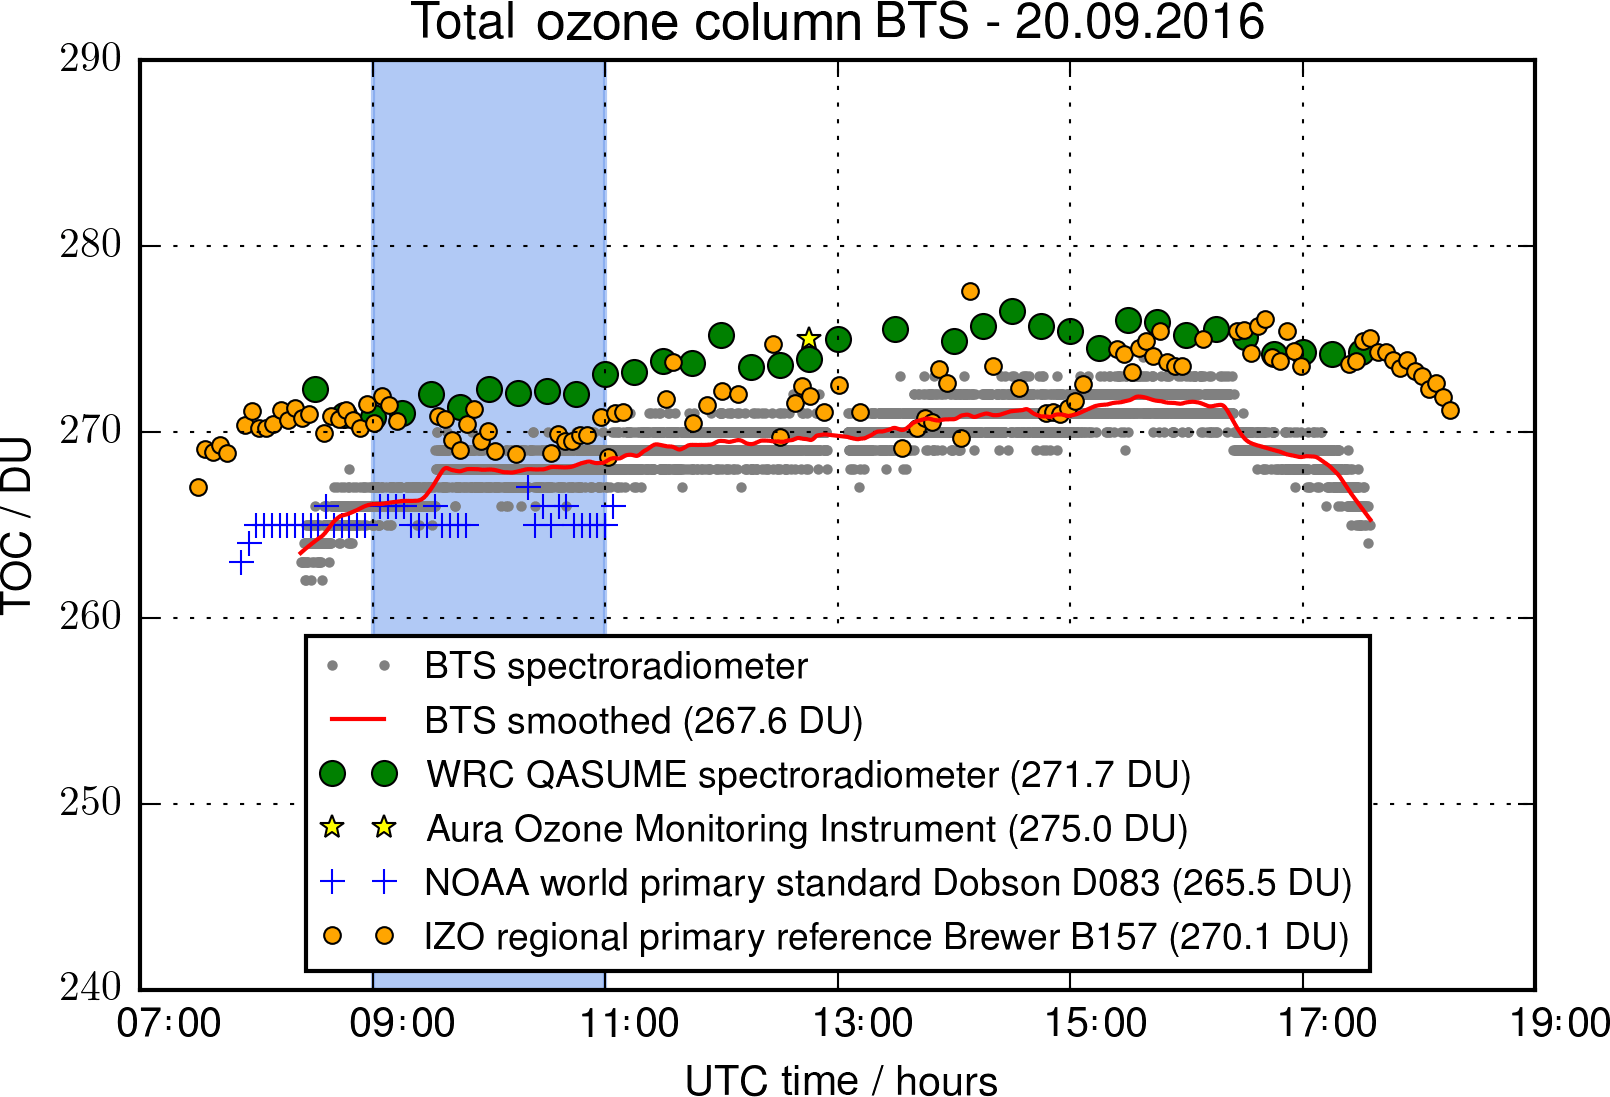
Figure 8Total ozone column (TOC) derived by the direct solar measurements of the BTS in comparison to other instruments. The measurements have been conducted during the ATMOZ intercomparison campaign on 20 September 2016. The TOC values stated in the legend for each ground-based instrument have been derived by averaging the values between 09:00 and 11:00 UTC (blue area). Grey dots symbolise the BTS TOC measurements captured every 8 s; only integer values are apparent due to the 1 DU resolution of the lookup table.
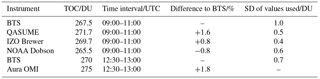
Table 2Comparison of the BTS-retrieved TOC values to other instrument values measured during the ATMOZ campaign. The data have been calculated based on measurements performed on 20 September 2016 between 09:00 and 11:00 UTC, shown in Fig. 8. For the comparison to the OMI data the average of the BTS TOC values measured between 12:30 and 13:00 UTC has been calculated. The SD of the averaged TOC values shows the dispersion of TOC values during that time period.
The spectral data have also been used to calculate the total ozone column based on a retrieval algorithm proposed by Masserot et al. (2002). For this purpose, the ratios of two wavelength bands, ranging from 305 to 310 nm and from 340 to 350 nm, have been calculated. The ratio is directly related to the TOC since the first band lies inside and the second one outside the ozone absorption range. By comparing these ratios to a set of pre-calculated model values stored in a lookup table, the most probable TOC value present during the measurement can be determined. The model values have been calculated with the libRadtran software package for radiative transfer calculations (Emde et al., 2016). The lookup table is a data cube with three dimensions and consists of roughly 6500 direct irradiance spectra with a wavelength range of 280 to 420 nm for SZAs between 24 and 90∘ and for TOC values between 250 and 350 DU (one Dobson unit (DU) is equivalent to 0.4462 mmol m−2; Basher, 1982). For the calculation of the ozone value of a specific measurement, all modelled spectra at the SZA apparent during the time of the measurement are first selected from the lookup table (see Fig. 6), and the ratios between the BTS measurement and all selected spectra are calculated. For the calculation of the lookup table, the following values for the input parameters have been chosen: an albedo of 0.2, a pressure of 773 hPa, an altitude of 2.36 km, an atmospheric profile typical for mid-latitude summer (Anderson et al., 1986) and the ozone cross section of Bass and Paur (1984). The temperature and ozone profile of the chosen atmospheric profile lead to an effective ozone temperature of 232.3 K. In contrast to Masserot et al., direct irradiance instead of global irradiance has been modelled as input for the lookup table to adapt the algorithm to the measurements performed with the BTS. Despite the low aerosol content in Izaña the aerosol default values of libRadtran have been used. This crude modelling of aerosol parameters is intentional in order to reflect the usually limited knowledge of the atmospheric aerosol parameters. The chosen aerosol parameters will lead to deviations between measured and modelled spectra over the whole wavelength range due to differences between the actual atmospheric condition and the assumptions made for the modelled spectra. This is addressed by performing a linear fit to the ratio between 330 and 355 nm (see Fig. 7), where ozone absorption is negligible and no “local” spectral features due to, e.g., strong absorption lines in the solar spectrum are apparent. The derived linear fit is applied to each ratio afterwards, effectively adjusting the ratios for atmospheric scattering processes with low wavelength dependencies (e.g. Mie scattering by aerosols or cloud droplets). The ratios are then averaged in the two wavelength bands from 305 to 310 nm and 340 to 350 nm. The resulting numbers are divided by each other for each ratio. The ratio closest to 1 corresponds to the modelled spectrum with the most likely ozone value apparent during the BTS measurement.
In Fig. 8, the results of the TOC calculations based on spectra of the direct solar irradiance measured on 20 September 2016 are shown. In addition, measurements performed on the same day with other instruments are displayed, namely with the WRC QASUME spectroradiometer, the world primary standard Dobson ozone spectrophotometer D083 from the World Dobson Calibration Center (WDCC) at NOAA, the regional primary reference Brewer spectrophotometer B157 of the Izaña Atmospheric Observatory and satellite measurements from the Aura Ozone Monitoring Instrument (OMI). Additionally, to directly compare the BTS-retrieved TOC to the other instrument data, the mean TOC values have been calculated during the time between 09:00 and 11:00 UTC. For the comparison with the Aura OMI data, the BTS data have been averaged ±15 min around the flyover time of the Aura satellite, resulting in a BTS TOC of 270 DU. The results are illustrated in Table 2.
The systematic differences between BTS and QASUME TOC values, even if the spectra of both instruments agree well as shown in Fig. 4, arise from different model approaches which are used for the TOC determination. In addition, the modelled TOC values of BTS and QASUME are based on slightly different input parameters for the atmospheric conditions. This is the case since we have chosen our parameters without knowledge of the QASUME parameters to ensure an unbiased comparison.
During the other measurement days of the campaign, where direct irradiance measurements were performed with the BTS spectroradiometer, the deviation to the other instruments did not exceed 3 % between 09:00 and 17:00 UTC. At air masses larger than 4 during sunrise and sunset, the signal-to-noise ratio decreases in the shortwave region of the spectrum and, therefore, the TOC estimations becomes noisier. In addition, at lower irradiance levels the detection threshold of the instrument increasingly affects the wavelength band from 305 to 310 nm, which leads to higher systematic uncertainties for the calculation. An initial analysis of the TOC determination uncertainty of the BTS device, which is in the range of 5 DU, was carried out by Vaskuri et al. (2017) based on a Monte Carlo method.
The BTS2048-UV-S series spectroradiometer is a versatile measurement system for spectroradiometric measurements in the UV spectral range. Its compact design, the fast sensor system and the hardware-based stray-light correction achieved with several optical filters may enable a wide range of radiometric applications.
After adapting the BTS2048-UV-S with a weatherproof housing for direct solar irradiance measurements (BTS2048-UV-S-WP) and an extensive device characterisation, the array spectroradiometer proved its capability in the challenging measurements of solar irradiance for atmospheric research.
Absolute direct solar irradiance measurements by the BTS2048-UV-S-WP showed deviations from the double-monochromator-based QASUME lower than ±2.5 % averaged over the spectral range from 300 to 420 nm. In the spectral range below the UV-B solar edge the deviation rises mostly due to slight differences in the wavelength calibration and insufficient signal-to-noise ratio since no averaging of the BTS data or longer integration time was possible for the 8 s measurement interval. TOC values derived from BTS2048-UV-S-WP data show agreement comparable to those obtained by Dobson and Brewer reference instruments. Based on the results and the experience gained during the measurement campaign, the design and the radiometric sensitivity of the BTS measurement system could be further improved by a factor of 4. This will very likely improve the performance of the system especially at higher SZAs and shall be tested in future measurement campaigns.
The data sets of the direct spectral irradiance measurements of the BTS2048-UV-S-WP at the Izaña Atmospheric Observatory on 20–22 September 2016 during the ATMOZ intercomparison campaign can be obtained at https://doi.org/10.6084/m9.figshare.6170345.v1 (Sperfeld et al., 2018).
The authors declare that they have no conflict of interest.
This work was supported by the European Metrology Research
Programme (EMRP) within the joint research project EMRP ENV59 ATMOZ
“Traceability for atmospheric total column ozone”. The EMRP is
jointly funded by the EMRP participating countries within EURAMET
and the European Union. The authors thank Julian Gröbner from
PMOD for providing the QASUME data sets.
Edited by: Pawan K. Bhartia
Reviewed by: two anonymous referees
Anderson, G. P., Chetwynd, J. H., Clough, S. A., Shettle, E. P., and Kneizys, F. X.: AFGL atmospheric constituent profiles (0–120km), Hanscom AFB, MA: Optical Physics Division, U.S. Air Force Geophysics Laboratory, 1986.
Basher, R. E.: Ozone absorption coefficients' Role in Dobson instrument ozone measurement accuracy, Geophys. Res. Lett., 9, 11, 1982.
Blanc, P., Espinar, B., Geuder, N., Gueymard, C., Meyer, R., Pitz-Paal, R., Reinhardt, B., Renné, D., Sengupta, M., Wald, L., and Wilbert, S.: Direct normal irradiance related definitions and applications: The circumsolar issue, Sol. Energy, 110, 561–577, https://doi.org/10.1016/j.solener.2014.10.001, 2014.
Dobson, G. M. B.: A photoelectric spectrophotometer for measuring the amount of atmospheric ozone, P. Phys. Soc., 43, 324–339, 1931.
Egli, L.: Post processing of data from array spectroradiometer, UVnet workshop 2014, Davos, Switzerland, 15–16 July 2014, available at: https://projects.pmodwrc.ch/env03/images/documents_workshop/Egli_et_al.pdf (last access: 25 April 2018), 2014.
Egli, L., Gröbner, J., Hülsen, G., Bachmann, L., Blumthaler, M., Dubard, J., Khazova, M., Kift, R., Hoogendijk, K., Serrano, A., Smedley, A., and Vilaplana, J.-M.: Quality assessment of solar UV irradiance measured with array spectroradiometers, Atmos. Meas. Tech., 9, 1553–1567, https://doi.org/10.5194/amt-9-1553-2016, 2016.
Emde, C., Buras-Schnell, R., Kylling, A., Mayer, B., Gasteiger, J., Hamann, U., Kylling, J., Richter, B., Pause, C., Dowling, T., and Bugliaro, L.: The libRadtran software package for radiative transfer calculations (version 2.0.1), Geosci. Model Dev., 9, 1647–1672, https://doi.org/10.5194/gmd-9-1647-2016, 2016.
Gröbner, J. and Sperfeld, P.: Direct traceability of the portable QASUME irradiance scale to the primary irradiance standard of the PTB, Metrologia, 42, 13, 2005.
Gröbner, J., Schreder, J., Kazadzis, S., Bais, A. F., Blumthaler, M., Görts, P., Tax, R., Koskela, T., Seckmeyer, G., Webb, A. R. and Rembges, D.: Traveling reference spectroradiometer for routine quality assurance of spectral solar ultraviolet irradiance measurements, Appl. Optics, 44, 5321–5331, 2005.
Gröbner, J., Kröger, I., Egli, L., Hülsen, G., Riechelmann, S., and Sperfeld, P.: The high-resolution extraterrestrial solar spectrum (QASUMEFTS) determined from ground-based solar irradiance measurements, Atmos. Meas. Tech., 10, 3375–3383, https://doi.org/10.5194/amt-10-3375-2017, 2017.
Hülsen, G., Gröbner, J., Nevas, S., Sperfeld, S., Egli, L., Porrovechio. G., and Smid. M.: Traceability of solar UV measurements using the QASUME reference spectroradiometer, Appl. Optics, 55, 7265–7275, 2016.
Masserot, D., Lenoble, J., Brogniez, C., Houet, M., Krotkov, N., and McPeters, R.: Retrieval of ozone column from global irradiance measurements and comparison with TOMS data. A year of data in the Alps, Geophys. Res. Lett., 29, 1309, https://doi.org/10.1029/2002GL014823, 2002.
Mayer, B. and Seckmeyer, G.: Retrieving Ozone Columns from Spectral Direct and Global UV Irradiance Measurements, peer reviewed proceedings of the Quadrennial Ozone Symposium L'Aquila, edited by: Bojkov, R. D. and Visconti, G., Int. Assoc. for Meteorol. and Atmos. Sci., L'Aquila, Italy, 935–938, 1998.
Nevas, S., Wübbeler, G., Sperling, A., Elster, C., and Teuber, A.: Simultaneous correction of bandpass and stray-light effects in array spectroradiometer data, Metrologia, 49, S43–S47, 2012.
Nevas, S., Gröbner, J., Egli, L., and Blumthaler, M.: Stray light correction of array spectroradiometer data for solar UV measurements, Appl. Optics, 53, 4313–43193, 2014.
Paur, R. J. and Bass, A. M.: The ultraviolet cross-sections of ozone: II. Results and temperature dependence, in: Proc. Quadrennial Ozone Symposium, Halkidiki, 3–7 September 1984, Greece, 611–616, 1984.
Pulli, T., Nevas, S., El Gawhary, O., Van den Berg, S., Askola, J., Kärhä, P., Manoocheri, F., and Ikonen, E.: Nonlinearity characterization of array spectroradiometers for the solar UV measurements, Appl. Optics, 56, 3077–3086, 2017.
Seckmeyer, G., Bais, A., Bernhard, G., Blumthaler, M., Booth, C., Disterhoft, P., Eriksen, P., McKenzie, R., Miyauchi, M., and Roy, C.: Instruments to Measure Solar Ultraviolet Radiation, Part 1: Spectral Instruments, Global Atmosphere Watch Report No. 125, World Meteorological Organization (WMO), 2001.
Seckmeyer, S., Bais, A., Bernhard, G., Blumthaler, M., Johnsen, B., Lantz, K., and McKenzie, R.: Instruments to Measure Solar Ultraviolet Radiation, Part 4: Array spectroradiometers, Global Atmosphere Watch Report No. 191, World Meteorological Organization (WMO), 2010.
Shafer, A. B., Megill, L. R., and Droppleman, L.: Optimization of the Czerny–Turner Spectrometer, J. Opt. Soc. Am., 54, 879–87, 1964.
Shaw, M. and Goodman, T.: Array-based goniospectroradiometer for measurement of spectral radiant intensity and spectral total flux of light sources, Appl. Optics, 47, 1–11, 2008.
Sperfeld, P., Pape, S., and Barton, B.: From Primary Standard to mobile measurements – Overview of the spectral irradiance calibration equipment at PTB, MAPAN-J. Metrol. Soc. I, 25, 11, https://doi.org/10.1007/s12647-010-0004-z, 2010.
Sperfeld, P., Riechelmann, S., and Zuber, R.: BTS direkt irradiance measurements Izana intercomparison 2016, https://doi.org/10.6084/m9.figshare.6170345.v1, 2018.
Vaskuri, A., Kärhä, P., Egli, L., Gröbner, J., and Ikonen, E.: Monte Carlo-Based Method for Determining Total Ozone Column Uncertainty: Izaña campaign, UV NEWS, 12, 13–15, 2017.
Vaskuri, A., Kärhä, P., Egli, L., Gröbner, J., and Ikonen, E.: Monte Carlo method for determining uncertainty of total ozone derived from direct solar irradiance spectra: Application to Izaña results, Atmos. Meas. Tech. Discuss., https://doi.org/10.5194/amt-2017-403, in review, 2018.
Zong, Y., Brown, S. W., Johnson, B. C., Lykke, K. R., and Ohno, Y.: Simple spectral stray light correction method for array spectroradiometers, Appl. Optics, 45, 1111–1119, 2006.