Seismologists are not surprised to see that the coronavirus lockdowns reduce seismic ambient noise; but what is emerging from the data is that the reduction is quite spectacular. This shows that human activities – road and railroad traffic, industrial machinery – account for a significant chunk of background Earth’s vibration: and that is a form of pollution that deserves more attention than it is receiving. In seismically active countries (think Japan, California, Italy) that are equipped with dense seismic networks, it also means that seismic instruments can serve to “monitor” those activities: see how they evolve over time, and contribute to evaluating their impact on the environment.
The Italian lockdown lasted about three months, during which our team has measured the level of ambient noise at Italian stations, and its variations over time, comparing it with pre-lockdown values and trends. A first instalment of our work has been published in the last issue of Scientific Reports.
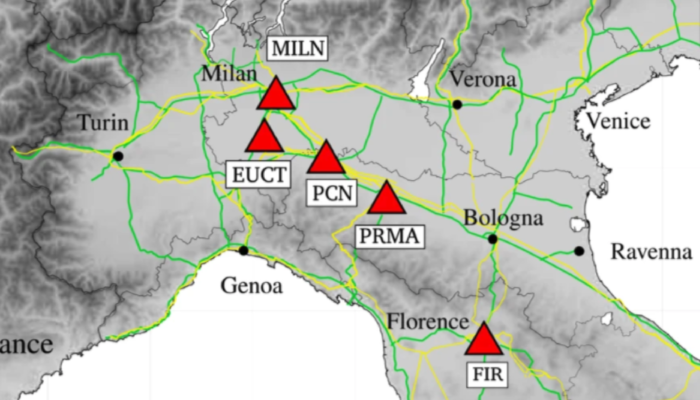
In comparison with the mind-boggling technicalities of most of a seismologist’s everyday work, what we do is fairly simple: we download ground displacement recordings from seismic stations, and average the signal over a few hours, a day, or a week (this is something one needs to experiment with); we repeat this procedure for all available stations in the Italian network. It is important to realize that what we are interested in is the “ambient” signal, or ambient noise, that exists independently of tectonic activity. Once all the downloading and averaging is done, we can compare averaged data that we obtained at different times, or at different stations. For example, the visuals in this post: in the plot at the top, the signal is averaged over one-day-long segments, and the station in Milan (MILN) is compared with that in Florence (FIR); the same comparison is further elaborated in the other two plots, or “spectrograms”, where the signal is filtered around different frequencies before visualization. (The reader with some knowledge of acoustics will quickly realize that these are all infrasounds: vibrations too low-pitched to be audible. Seismometers are designed to record that kind of signal and in that sense, our observations are complementary to those that can be made with microphones.)
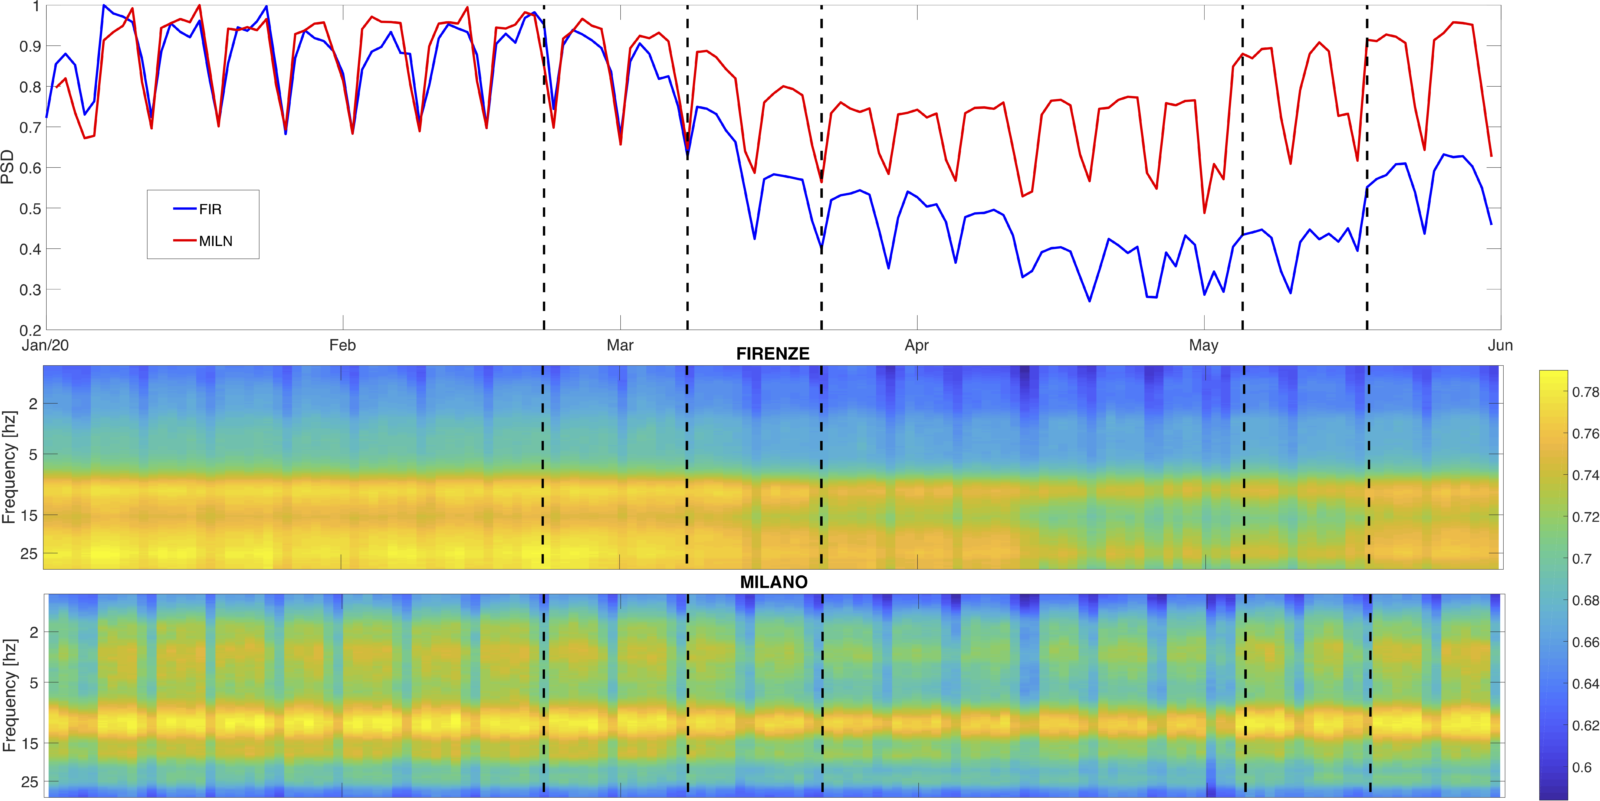
From the spectrograms one can appreciate, for instance, that ambient noise in Milan is dominated by vibrations at about 3 Hz and 10 Hz, and the former are affected by the lockdown more than the latter; in Florence, noise is prominent at about 10 and 25 Hz. It appears from both curves and spectrograms that the lockdown has been stricter in Florence than in Milan – or, at least, stricter near FIR than near MILN. The trends with respect to time also differ, with noise recorded at FIR continuing to decrease over the course of the lockdown, then rising sharply at the May-18 reopening but without yet regaining it is normal (January, February) level; at MILN, the noise started to bounce back to its original level already during the lockdown, and by the end of May is almost back to normal.
The purpose of our article (and of this post) is not to analyze in-depth the nature of “anthropic” seismic noise; but, rather, to show convincingly that data from seismic networks can very effectively help us do it. And recordings made during the coronavirus lockdown are very important, because if we compare signal before (and/or after) vs. during the lockdown we can precisely isolate the effects of the sources of noise that have been, actually, locked down: it might be impossible to identify them otherwise. We hope that our work, and other similarly minded efforts by colleagues around the world, will contribute to a new wave of studies in environmental seismology and acoustics, both in the solid earth and in oceans; and we hope that our discipline will help to understand how human activities disrupt the environment, in ways that so far have been neglected. Understanding these phenomena would be a first step towards mitigating their unwanted effects.
Reference
Poli, P., Boaga, J., Molinari, I., Cascone, V., Boschi, L. (2020). The 2020 coronavirus lockdown and seismic monitoring of anthropic activities in Northern Italy, Science Reports, https://www.nature.com/articles/s41598-020-66368-0
This blog post was written by Lapo Boschi
with revisions from Walid Mansour and Maria Tsekhmistrenko