Even before the global pandemic reshaped how we share our scientific research, presenting our results online has become more and more a normal activity for researchers around the world. Digital conferencing, remote presentations and pre-recorded talks shared over the internet have a lot of positives and negatives, not least of which is the ability to share your work with a wider audience than might be able to attend a physical presentation, but how do you ensure that you are making the most of that opportunity? How do you make sure that your presentation is as accessible as you can possibly make it?
To help presenters preparing their talks for vEGU21, whether you are choosing to upload a series of slides with your data or video record and pre-upload your whole talk (or both!), we have put together some top tips to help you share your research with as wide an audience as possible.
Live captions, craptions and accessiblity.

The closed caption symbol ‘cc’ lets users know when a transcription of the dialogue is available. (Image credit: Wikimedia)
Whether the person attending your talk is Deaf or has a hearing disability, or perhaps English is not their first (or second, or third) language, good closed captions can be essential to help that person understand your presentation. At EGU we are keen to support accessibility for our talks, so all Union Symposia, Great Debates and Union Medal Lectures will have a live stenographer. We will also be providing AI-based closed captioning for all other Medal and Award Lectures, as well as short courses, and all the 2 minute summary presentations will have google based closed captions.
But as the acceptance of live captioning of scientific talks becomes more widespread, we have all seen examples of how it can go wrong, when the software mistakes a scientific word, or cannot master a strong accent. These are often called ‘craptions‘ and although it may be tempting to find them funny, publicly mocking incorrect captions and turning them into a joke is a form of ableism that negates the fact that many people rely on good captions to be able to participate in scientific events. EGU and our conference partner Copernicus have done research into the best AI live captioning systems available, but there are things that you as the presenter can do to help us avoid craptions as much as possible. So what can we do to make vEGU21 live captions better?
Well, to start with, we have three tips to help you improve your AI-dependent live captions:
- Speak slowly and communicate clearly. This helps the automated transcription service to track your words and have a higher success rate. It also helps people understand your talk better regardless, and with pre-recording and uploading your full talk an option for vEGU21, you can have a few attempts until you get it just right.
- Practice with your live closed-captioner turned on. AI based closed captioning services are smart – they learn from you and your speech patterns – so the more you practice speaking into your live closed caption service, the more accurate it becomes, even for fairly complex scientific words. Try Powerpoint, Otter.ai, Google slides or Rev for live captioning, and if you have worked with a captioner, and it knows you and your speech style well, let the organiser know, so they can preferentially use your software where possible.
- Use an external microphone. Your inbuilt microphone in your computer or laptop will not be able to capture your speaking voice clearly enough, so you need to have some kind of external microphone (even one on headphones or a headset will do) to really give the AI closed captioner the best chance at success. This is another good tip for online presenting in general; for an audience to hear you, you need an external microphone.
Also if you are particularly worried about certain words, include technical language written simply on the slide. This is not an excuse to present a block of text, but if you need to present a word that you know live captioners struggle with, then include the word written clearly and plainly on your slide. You can also pre-caption your own recorded video uploads, so you know they are correct.
For more great tips, read this Eos blog post on best practices for live captioning or read Stephanie Zihms’ blog post about how to record accessible videos for teaching.
When a picture doesn’t paint a thousand words.
Similar to live captioning, presenters are becoming more and more aware of how to create accessible images for their talk. Images can sometimes be difficult to understand for many reasons and yet a well designed and carefully selected image can be key for many people to really connect with the researcher’s idea. Good images obvious when you see them, but it is also still easy to make mistakes and create a confusing or even misleading image or graph, at any stage of your career.
Try these three tips to help bring your vEGU21 images to the front of the stage:
-
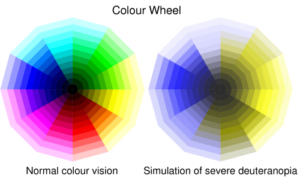
This image highlights the de-saturation of certain colours that colour vision deficiency (in this case deuteranopia) can have on a standard colour wheel, demonstrating just one of the reasons why a rainbow scale is not a good choice for graphics. (Image credit: Ed Hawkins)
Rainbow scales are bad for presenting and interpreting data. Not only do colours in rainbow scales have emotional and perceptual meanings that cause people to incorrectly interpret them (yes, researchers too), they are very difficult for many people to even read in the first place. Just say no.
- Contrast and clarity in your slides is key. When it comes to creating a presentation that is accessible, bear in mind that a reasonable proportion of your audience will have a colour-vision deficiency. High contrast between your text and the background of your slide helps and you can even test how well your images perform for people with different colour-vision deficiencies by using test websites like Coblis. Clarity and simplicity in your slides are key, to help everyone follow your talk.
- Describe and explain your images. This may seem simple, but if there is an image on your slide and you don’t explain it, then you aren’t making it accessible or effective. Talk through the image piece by piece, and then explain its relevance. There is nothing as excluding as having someone say ‘as you can see here’ and then moving on with a related point without describing or explaining what you can see. These images and diagrams may be familiar to you as the speaker, but there will certainly be someone in the audience who can’t see what you are referring to, whether because of a disability, or maybe because they are new to the field (or both!). Describing and explaining your images helps everyone.
These points are obviously just the very start of how we can all work to make presentations more accessible, and build on advice for visually accessible and audio accessible presenting that we have given previously, as well as using inclusive language in talks.
For more resources check out the Equality, Diversity and Inclusion in Geosciences project resources page and please feel free to share tips, ideas and other useful resources in the comments – we are all here to learn and share together, and make our research as accessible, for as many people, as possible.
Find out more about what EDI events are happening this week with the What’s on at vEGU21: EDI flyer!