the Creative Commons Attribution 4.0 License.
the Creative Commons Attribution 4.0 License.
 | 07 Sep 2018
Mechanisms leading to the 2016 giant twin glacier collapses, Aru Range, Tibet
Silvan Leinss
Jeffrey Kargel
Andreas Kääb
Simon Gascoin
Gregory Leonard
Etienne Berthier
Alina Karki
Tandong Yao
In north-western Tibet (34.0∘ N, 82.2∘ E) near lake Aru Co, the entire ablation areas of two glaciers (Aru-1 and Aru-2) suddenly collapsed on 17 July and 21 September 2016. The masses transformed into ice avalanches with volumes of 68 and 83×106 m3 and ran out up to 7 km in horizontal distance, killing nine people. The only similar event currently documented is the 130×106 m3 Kolka Glacier rock and ice avalanche of 2002 (Caucasus Mountains). Using climatic reanalysis, remote sensing, and three-dimensional thermo-mechanical modelling, we reconstructed the Aru glaciers' thermal regimes, thicknesses, velocities, basal shear stresses, and ice damage prior to the collapse in detail. Thereby, we highlight the potential of using emergence velocities to constrain basal friction in mountain glacier models. We show that the frictional change leading to the Aru collapses occurred in the temperate areas of the polythermal glaciers and is not related to a rapid thawing of cold-based ice. The two glaciers experienced a similar stress transfer from predominant basal drag towards predominant lateral shearing in the detachment areas and during the 5–6 years before the collapses. A high-friction patch is found under the Aru-2 glacier tongue, but not under the Aru-1 glacier. This difference led to disparate behaviour of both glaciers, making the development of the instability more visible for the Aru-1 glacier through enhanced crevassing and terminus advance over a longer period. In comparison, these signs were observable only over a few days to weeks (crevasses) or were absent (advance) for the Aru-2 glacier. Field investigations reveal that those two glaciers were underlain by soft, highly erodible, and fine-grained sedimentary lithologies. We propose that the specific bedrock lithology played a key role in the two Tibet and the Caucasus Mountains giant glacier collapses documented to date by producing low bed roughness and large amounts of till, rich in clay and silt with a low friction angle. The twin 2016 Aru collapses would thus have been driven by a failing basal substrate linked to increasing pore water pressure in the subglacial drainage system in response to increases in surface melting and rain during the 5–6 years preceding the collapse dates.
- Article
(31272 KB) -
Supplement
(2117 KB) - BibTeX
- EndNote


In the Aru Mountain range on the western Tibetan Plateau, the entire ablation zone of an unnamed glacier (termed here Aru-1) spontaneously collapsed on 17 July 2016. This occurred despite its low slope angle of only 13∘ (Tian et al., 2016) compared to typical ice avalanches occurring from the failure of much steeper hanging glaciers (Faillettaz et al., 2015). The Aru-1 glacier collapse produced an ice avalanche with speeds exceeding 200 km h−1, spread over a 7 km long and 3 km wide deposit, and killed nine herders and hundreds of their animals (Kääb et al., 2018). This event was followed by the collapse of the adjacent glacier south of Aru-1 2 months later, on 21 September 2016, producing a similar low-angle giant avalanche (see Fig. 1b). Such catastrophic glacier collapses are extremely rare in size and mobility. Only one similar case has been documented before, the Kolka–Karmadon glacier collapse in the Caucasus Mountains in 2002 (Kääb et al., 2003; Huggel et al., 2005; Evans et al., 2009). In order to anticipate similar potential hazards in other populated mountain areas it is crucial to understand in detail the mechanisms involved and identify potential triggers and factors responsible for these extreme mass movements. The collapses raise the question of whether similar future events affecting other glaciers might be influenced by ongoing climate change.
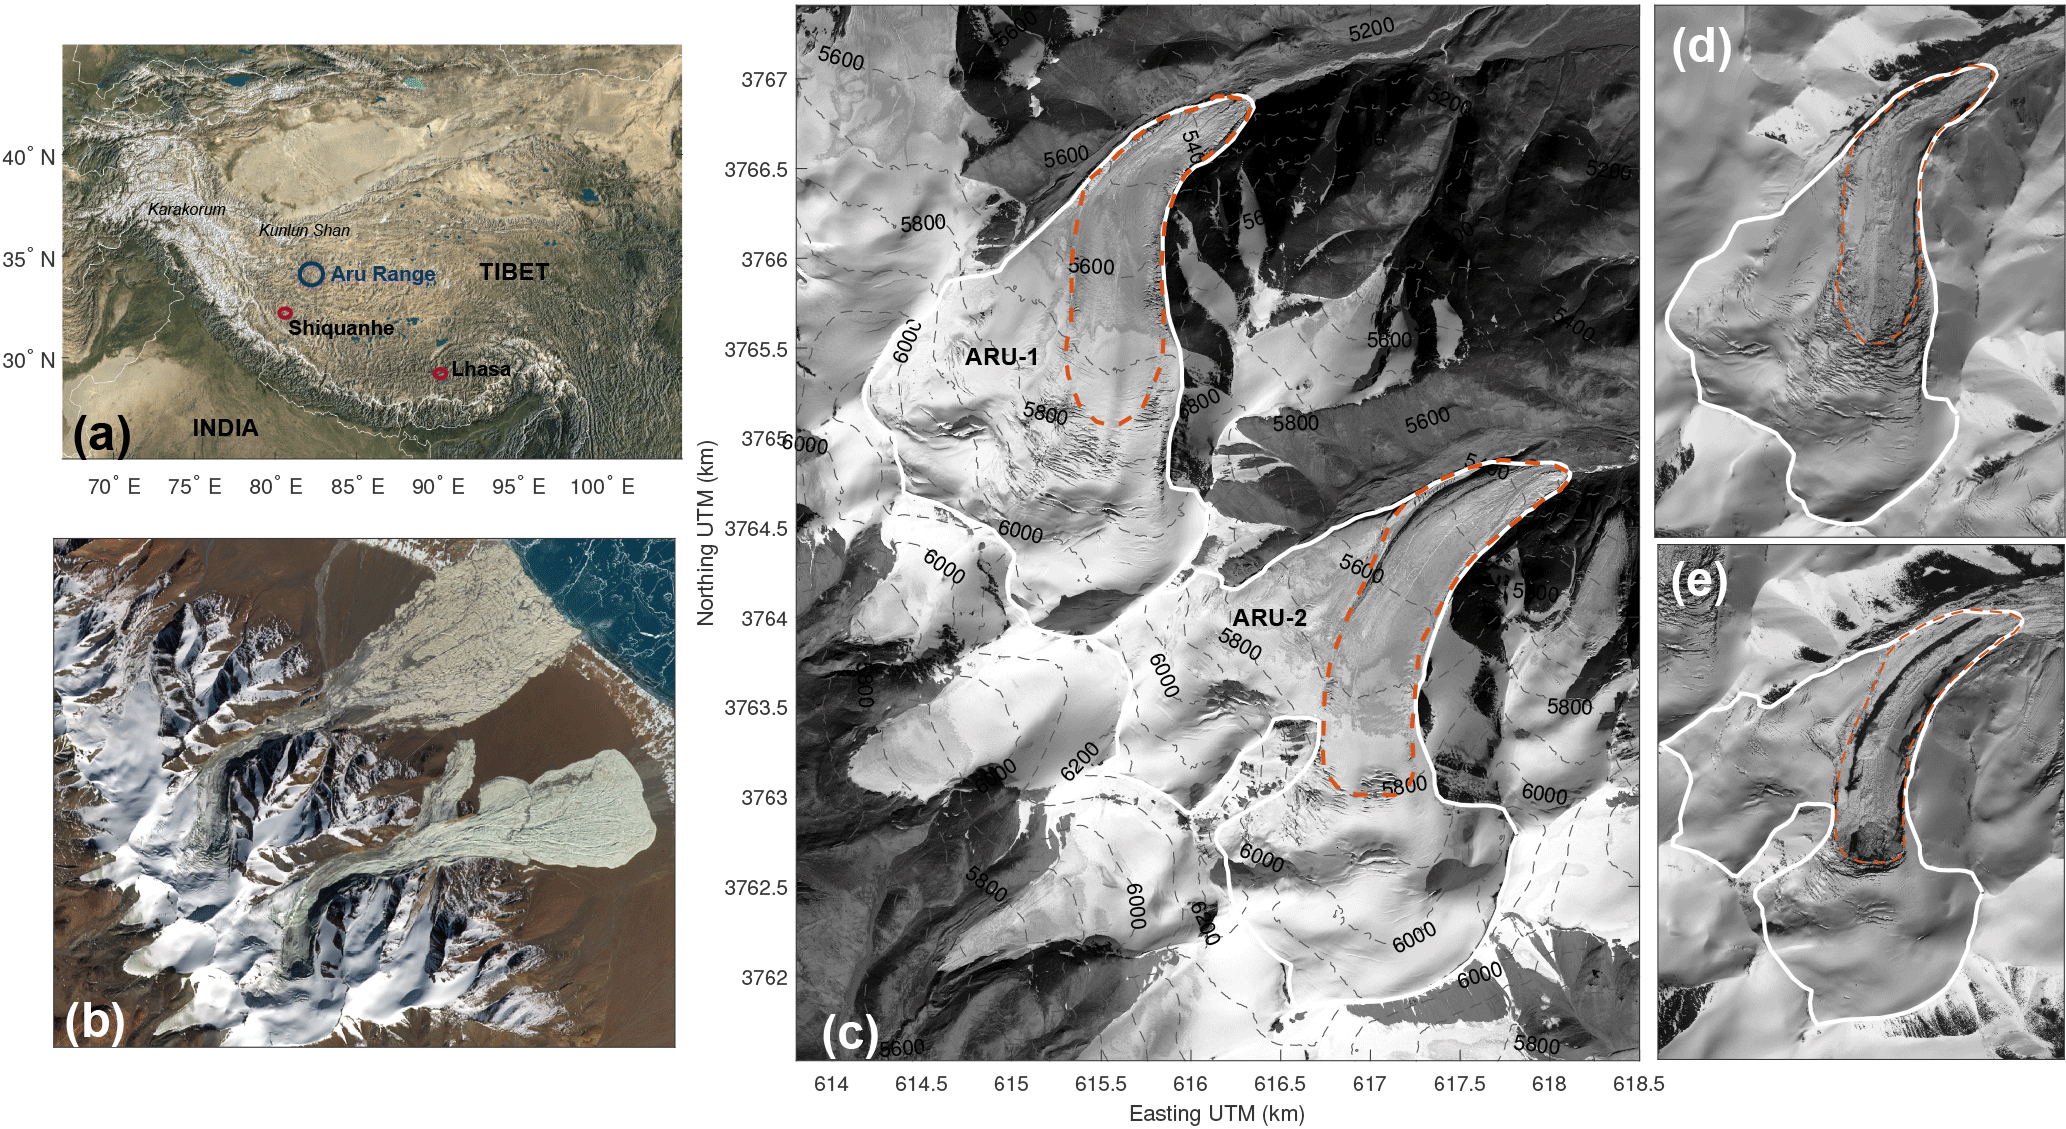
Figure 1(a) Location of the Aru Range in Tibet and (b) Sentinel-2 image from 8 December 2016 after the collapses (contains modified Copernicus Sentinel data 2016). (c) Elevation contour lines of Aru-1 and Aru-2 glaciers (vertical datum WGS84) overlaid on an orthorectified Spot7 image from 2015 (Copyright Airbus D&S), 21 September as background used also in all other figures unless otherwise stated; orange dashed lines indicate the detachment outline; white lines are the glacier outline as of 2015. (d, e) Pléiades images from 1 October 2016 of the two glaciers Aru-1 (d) and Aru-2 (e) after the collapses (copyright CNES 2016, Distribution Airbus D&S).
Applying satellite image analysis and glacier mass balance modelling, Kääb et al. (2018) explored the long-term behaviour of the two Aru glaciers prior to collapse. They show that the two glaciers started a surge-like instability around 2010, probably in response to both increasing precipitation and temperature in the region and related positive mass balances. Their preliminary analysis of the two-dimensional (2-D) thermal glacier regime shows a polythermal structure for the two glaciers. Such a structure would likely have provided resisting forces against whole-glacier sliding, but would have promoted englacial drainage to the bed in the lower temperate part of the accumulation zone, with possible local sliding and contributing to swelling or inflation of the glacier toe above and behind the frozen part. Facing the enigma of two neighbouring glaciers undergoing similar catastrophic behaviour close in time that is otherwise almost globally unique, Kääb et al. (2018) also point out the possible role that soft bedrock lithologies and glacier till production played in the instabilities.
In this study, we significantly extend the numerical analysis of the Aru glacier instabilities and discuss in detail the mechanisms leading to the collapses. We use a three-dimensional (3-D) full-Stokes thermo-mechanical model in order to (i) reconstruct the bedrock topography, (ii) analyse the thermal regime of the glaciers in 3-D, (iii) infer the evolution of basal friction prior to the collapse, and (iv) quantify the stress distribution that led to the final collapses. We then combine the modelling results with field investigations to further elaborate on the role of bedrock lithology and discuss the related origin of the twin collapses. Finally, we summarize key characteristics to recognize on other glaciers, and lithologic and thermal regimes that are similar to the Aru glaciers to help identify new potential collapses in the future.
The Aru Range is located on the remote western Tibetan Plateau (34∘ N, 82∘ E), where very few glaciological or meteorological observations are available (Fig. 1). Prior to Kääb et al. (2018), the two collapsed glaciers were never studied and the entire modelling work of this study is therefore based on remote sensing data and climatic reanalysis. Digital elevation model (DEM) differencing provided both the observations on the glacier transient dynamics and the mean mass balance over different time periods needed to calibrate the models. Kääb et al. (2018) compared different sources of local climatic data in order to reproduce remote-sensing-based mass-balance observations and concluded that the ERA-Interim reanalysis provides the best estimate of the Aru Range climate, if the respective precipitation amounts are corrected by a multiplying factor of about 4. Here, we use their mass balance model to constrain the thermo-mechanical model described in Sect. 3.2.
2.1 Digital elevation models (DEMs)
Table 1Different DEMs used in this study produced from satellite data.
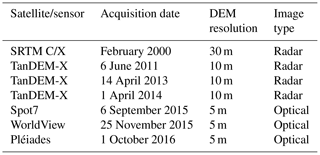
We use seven different DEMs derived from different satellite missions between 2000 and 2016 (see Table 1). The SRTM C-band radar DEM from mid-February 2000 (Farr et al., 2007) is used as the steady-state reference of the two glaciers for reconstructing bedrock topography. A Pléiades optical satellite stereo DEM from 1 October 2016, after the collapse, allows us to evaluate the modelled bedrock reconstruction over the detachment zone. We compute ice emergence velocities by differencing pre-collapse high-resolution DEMs from TanDEM-X, Spot7, and WorldView data and correct these for mass balance following the approach described in Gilbert et al. (2016) (Fig. 2). The effect of uncertainty linked to radar penetration in the TanDEM-X data should be minimized when comparing same wavelength data (X-band) at similar times of the year. Changes in penetration depth between the TanDEM-X data of 2011 (early June) and 2013 (mid April) due to different snow wetness should also be limited because surface melting in the accumulation area of the Aru glaciers only occurs from around mid-June (Kääb et al., 2018). X-band penetration into glacier ice (i.e. the Aru glaciers ablation areas) is very limited anyway (Dehecq et al., 2016). Comparing Spot7 (2015) and TanDEM-X (2014) elevations likely introduces uncertainty from TanDEM-X penetration in the accumulation area leading to higher apparent emergence velocities in this part (visible in Fig. 2). This problem only influences our friction reconstruction in the upper parts of the glaciers but not in the detachment areas. Details on DEM accuracies and acquisition methods can be found in Kääb et al. (2018).
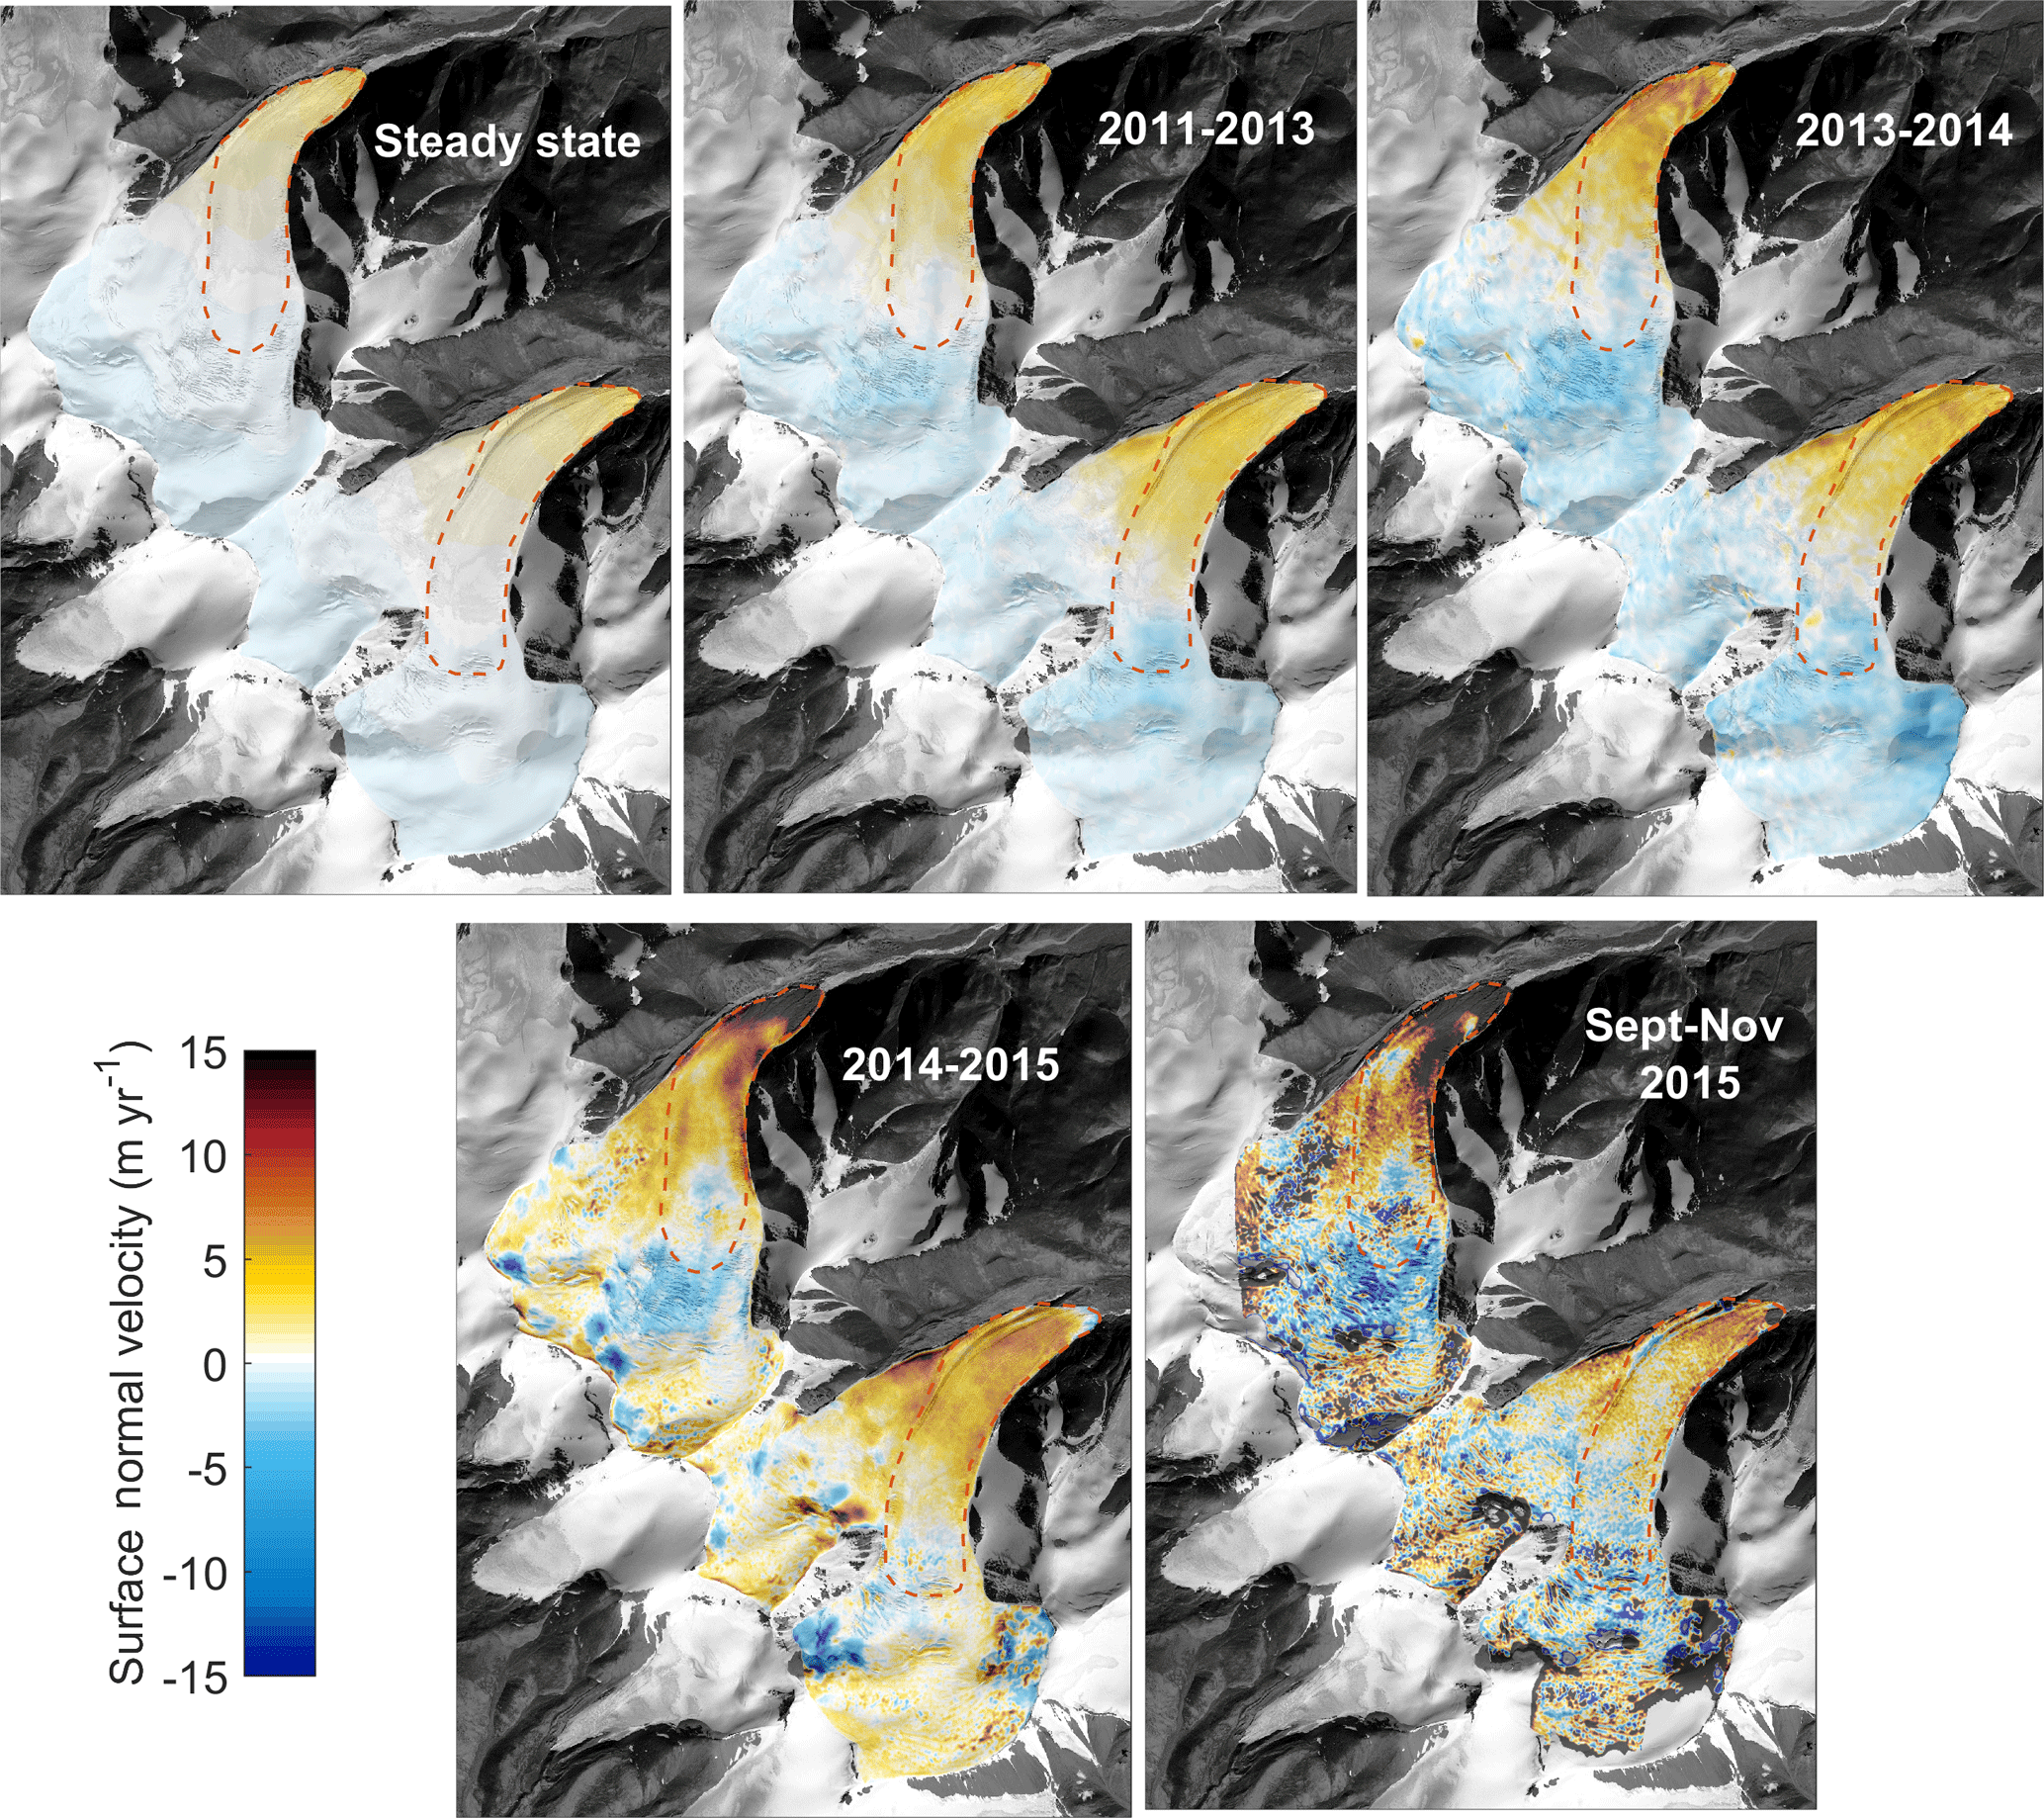
Figure 2Mean emergence velocities obtained by differencing elevation changes from repeat DEMs and modelled mass balances during different periods prior to the collapses. Steady-state velocities in the first panel are modelled. Orange dashed lines indicate the detachment outline.
2.2 Field observations
We investigated glacier till properties by analysing samples collected from the Aru-1 avalanche deposit in the gorge close to the former glacier tongue. We collected these samples 1 year after the collapse on 18 July 2017. Rainy conditions on that day highlighted the behaviour of the surrounding lithology that quickly turned into a soft and unstable slurry in the presence of water. Additional information about our samples can be found in Figs. S1–S3 in the Supplement.
3.1 Mass balance
Our mass balance model for the two Aru glaciers is based on a degree-day model described in Gilbert et al. (2016). It has been calibrated for the Aru glaciers by using satellite-derived glacier mass balances and is fed by ERA-Interim climate reanalysis (Kääb et al., 2018). The model output, taken from Kääb et al. (2018), provides the spatio-temporal distribution of surface mass balance, firn thickness, and available surface meltwater for percolation/refreezing in the firn to constrain the thermo-mechanical model below.
3.2 Thermo-mechanical model
Our thermo-mechanical ice-flow model is based on the Stokes equation coupled with an energy equation using the enthalpy formulation (Aschwanden et al., 2012; Gilbert et al., 2014). Changes in the glacier geometry are computed using a free surface equation (Gilbert et al., 2014). We adopt a pure viscous isotropic ice rheology following Glen's flow law (Cuffey and Paterson, 2010). The model is solved using the finite-element software Elmer/Ice (Gagliardini et al., 2013). Parameters and variables of our model set-up are summarized in Table 2.
Table 2Variables and parameters of the thermo-mechanical model.
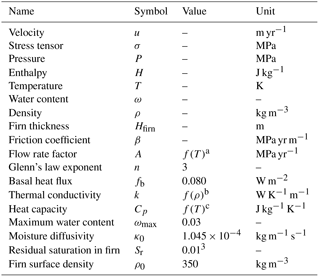
a Cuffey and Paterson (2010). b Calonne et al. (2011). c Gilbert et al. (2014).
We adopt a linear friction law as a basal boundary condition for the Stokes equation:
where τb is the basal shear stress (MPa), us is the sliding velocity (m yr−1), and β is the friction coefficient (MPa yr m−1). This coefficient is inverted using a control inverse method to minimize a cost function defined from the misfit with measured surface data and a regularization term (Gillet-Chaulet et al., 2012; Gagliardini et al., 2013). Following Gilbert et al. (2016) we used the emergence velocity (m yr−1) to compute this cost function:
where is the modelled emergence velocity (m yr−1), u is the surface velocity vector (m yr−1), is the unit vector normal to the surface, Γs is the surface boundary, Jreg is the regularization term, Γb is the bedrock surface boundary, and λ is a positive number. The emergence velocity is obtained by removing the mean modelled mass balance from the elevation change rate measured from our repeat satellite-derived DEMs over the same periods (Fig. 2):
where is the measured elevation change rate (m yr−1) and M is the mean surface mass balance during the corresponding period (m yr−1).
The surface boundary condition is set as a stress-free boundary for the Stokes problem and a Dirichlet condition for the enthalpy equation. In order to take into account water percolation and refreezing within the firn, we follow the approach by Gilbert et al. (2015), using a 6-month time step. Latent heat due to refreezing is released every year during the summer time step. The firn-thickness distribution is estimated from the mass balance model following Gilbert et al. (2016) and the firn density is computed using a linear density profile set to the following:
where ρ is the density (kg m−3) at depth d (m), ρ0 is the surface density, ρice is the ice density, and Hfirn is the firn thickness (m).
The lateral boundary condition is set to a no-flux condition for both the Stokes and enthalpy equations. We assume a basal heat flux of W m2 for the enthalpy equation according to heat flux measured in boreholes at the Guliya ice cap (6200 m a.s.l., 200 km north of the Aru Range) (Thompson et al., 1995) and modelled geothermal heat fluxes for the region (Tao and Shen, 2008).
3.3 Modelling strategy for the steady-state glaciers
The first step of modelling the dynamics and thermal regime of the Aru glaciers is to establish a steady-state glacier as the initial condition for 1970 (start of the climatic reanalysis used). Landsat satellite images of the glacier area and the mass balance model indicate that the two glaciers were close to equilibrium from 1970 to 1995 (Kääb et al., 2018). We therefore assume that the surface topography measured in February 2000 by the SRTM mission (oldest available DEM) is representative of the glaciers, being in equilibrium with the mean climate over this period, although the positive mass balance between 1995 and 2000 probably thickened the glacier by a few metres in the accumulation area. We use the mean mass balance between 1980 and 1995 as an equilibrium mass balance considering that modelled mass balance is close to steady state during this period, before becoming positive from 1995 to 2008 (Kääb et al., 2018).
We first run the model on a 2-D flow line until a steady state is reached, deriving bedrock topography in the detached parts from a post-collapse Pléiades DEM and by reconstructing the bed at the upper glacier parts, assuming a constant basal shear stress (plastic approximation; Cuffey and Paterson, 2010). This initial step allows for the first approximation of the steady-state thermal regime which we presented in Kääb et al. (2018). We then use the 10 m depth temperature modelled with the flow line model to define the steady-state surface enthalpy as a function of elevation, which includes meltwater percolation and refreezing effects. This relationship is used to define a Dirichlet surface boundary condition for enthalpy in order to solve the steady-state thermal regime of the glaciers in 3-D in the bedrock inversion procedure (Sect. 3.3.1). Because the effects of meltwater percolation and refreezing are already included in the surface enthalpy value, there is no need to solve for these effects in diagnostic runs. The final 3-D steady-state glacier solution is obtained by running a transient simulation using the inverted bedrock topography and solving water percolation and refreezing until surface topography and the enthalpy field reach equilibrium with the imposed climatic condition.
3.3.1 Reconstructing bedrock topography
Using constant climatic conditions associated with the balanced glacier conditions corresponding to the SRTM DEM, we determined the bedrock topography, allowing the best match between modelled and observed (i.e. SRTM DEM) surface topography (van Pelt et al., 2013). For this purpose, we ran a 3-D transient simulation assuming no sliding, fixed surface topography (SRTM DEM), and constant surface forcing (mass balance and enthalpy). The no-sliding assumption is likely a good assumption in 2000 since the glacier was not surging at this time (Kääb et al., 2018). Mesh horizontal resolution is set to about 50 m with 15 vertical layers. The evolution of the free surface is taken into account by varying the basal mesh elevation instead of the surface elevation. The mesh surface topography thus remains constant, while the bed topography is updated by solving the equation
where zbed is the bedrock elevation (m), vs is the surface horizontal velocity (m yr−1), zbed0 is the initial bedrock topography (m), M is the surface mass balance (m yr−1), ws is the vertical component of the surface velocity (m yr−1) and zs0 is the measured surface elevation (m). The right side of Eq. (6) vanishes once bedrock topography satisfies the required topography to keep zs0 constant for a given mass balance M. The advective term on the left side of Eq. (6) allows zbed to be smoothed in the flow direction. The enthalpy field is solved at each time step by solving the steady-state equation for the current velocity field and mesh. We start with a uniform 200 m ice thickness (rough maximum expected thickness on the glacier) and run the model until a steady bedrock topography is reached. This generates a new zbed0 value to re-run the model until a new steady state is reached. After only two iterations, we validate the modelled bedrock topography by running the model with the new fixed bedrock topography and free surface evolution. The resulting surface topography is in excellent agreement with the measured one (Fig. 3), indicating that our method to infer the bedrock topography works well for these two glaciers.
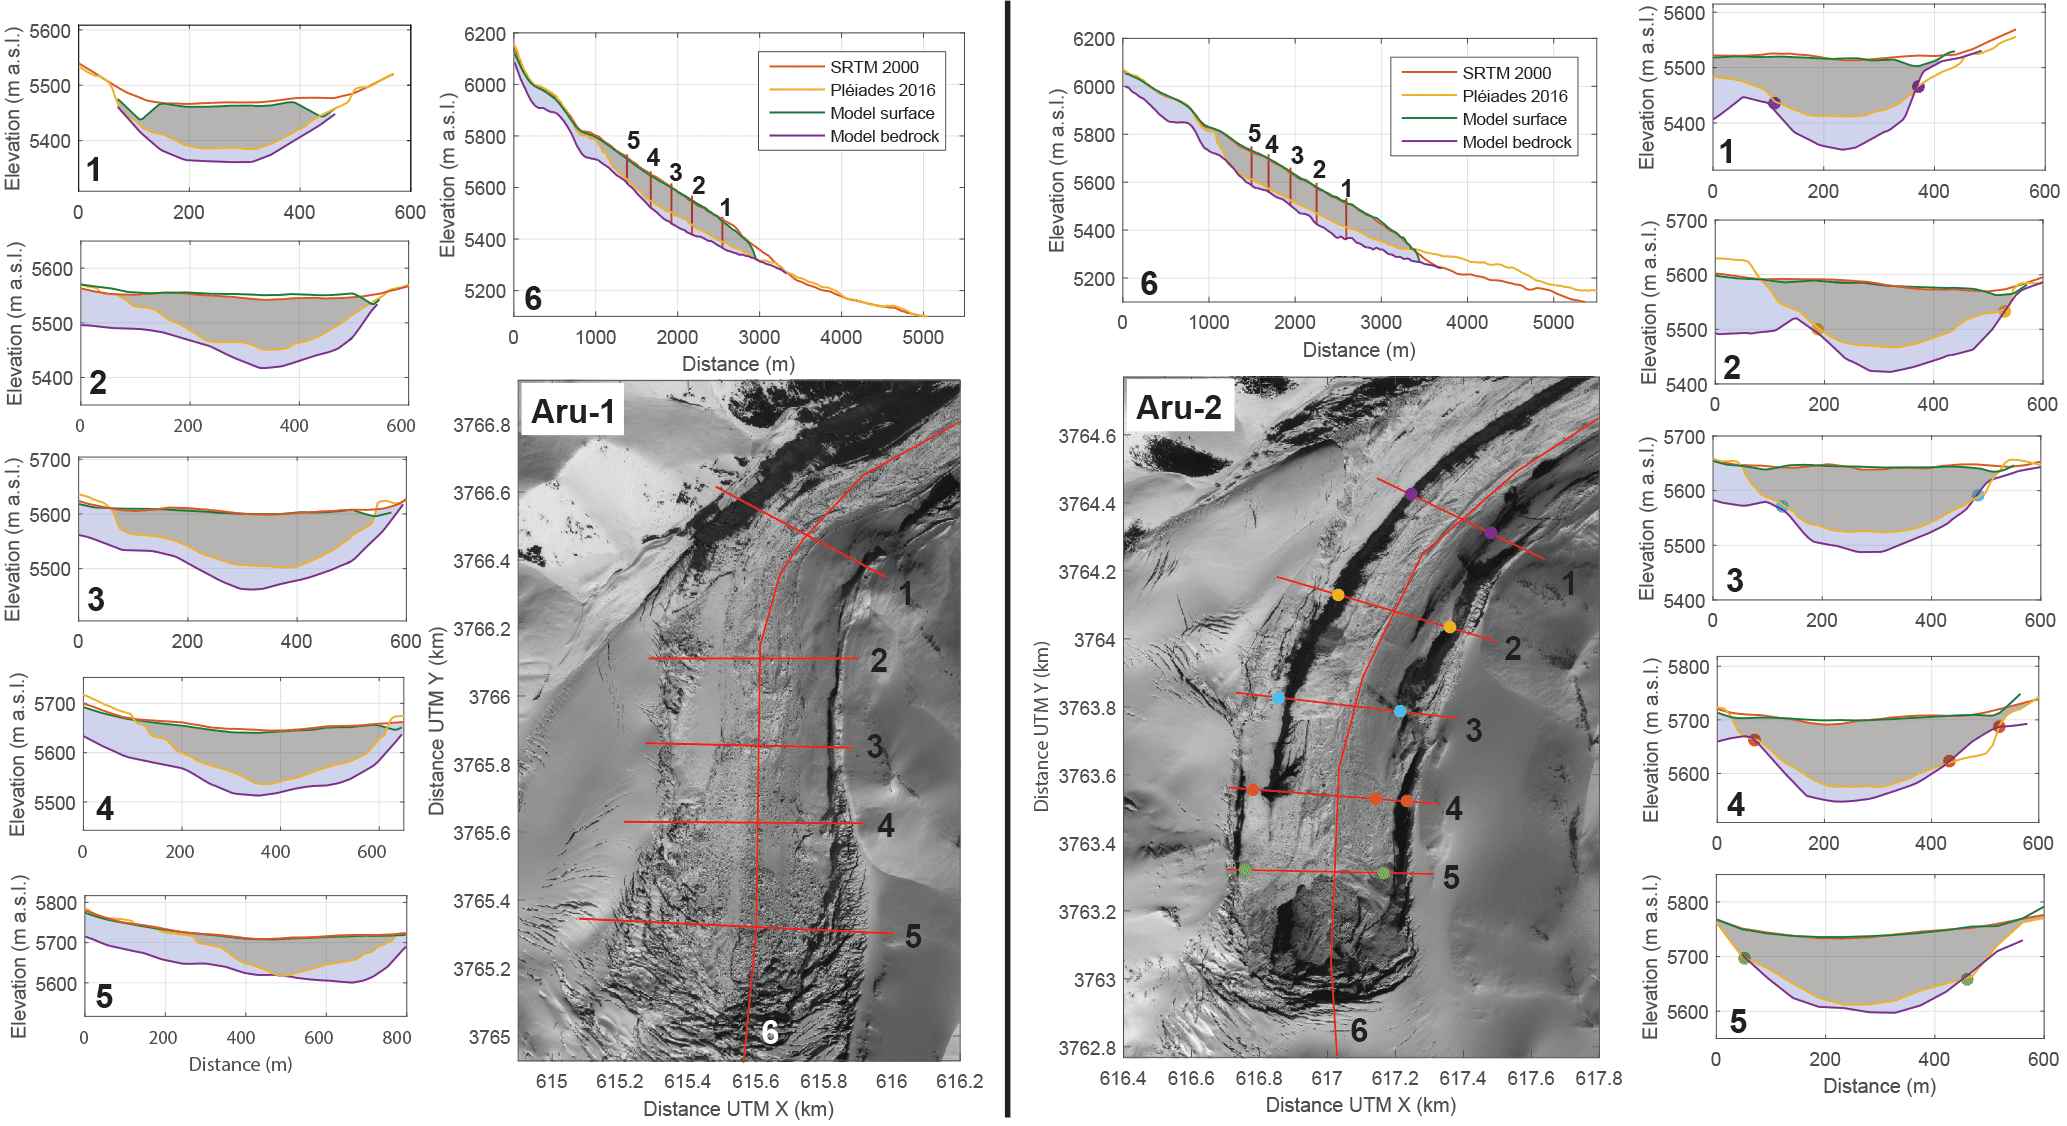
Figure 3Pléiades image of Aru-1 (left) and Aru-2 (right) glaciers after collapse, with topographic profiles 1 to 6 plotted for both glaciers (Copyright CNES 2016, Distribution Airbus D&S). The topographic profiles 1 to 6 show the measured surface topography in 2000 (SRTM, in red) and 2016 after the collapse (Pléiades, in yellow). These profiles are compared with the modelled bedrock (in purple) and surface (in green) topographies. The coloured dots on the Aru-2 glacier show the location of specific points of the profiles in the Pléiades image. Those points correspond to locations where our reconstruction matches the Pléiades DEM and where bedrock should thus be visible on the Pléiades image (no ice debris). Grey shading indicates the detached parts according to the Pléiades DEM compared to SRTM.
We use the opportunity provided by the exposed detachments to compare the reconstructed bedrock topography with the measured Pléiades DEM from after the collapses (Fig. 3). On the Aru-2 glacier, the points at which bedrock is clearly visible in the Pléiades images match well with the locations where our reconstructed bedrock topography matches the Pléiades DEM (dots in Fig. 3). Elsewhere in the Aru-2 glacier detachment zone, the modelled bedrock is deeper than the observed surface elevation; this is likely due to the remaining ice debris overlying the actual bedrock, so the Pléiades DEM elevations are expectedly higher. This is confirmed by the good continuity between the ground topography measured outside of the former glacier tongue and the one inferred from our bedrock reconstruction (see Fig. 3, profile 6). On the Aru-1 glacier, the reconstructed bedrock on profiles 2, 3, and 4 is systematically deeper than the Pléiades DEM, even on the steep side, close to the margin of the glacier where no ice remained after the collapse. This means that ice flow is not accurately modelled in this part, likely due to the premise of no sliding, which is probably not accurate considering that the glacier may have been temperate at its base here (see Sect. 4.1). The error in the modelled bed topography of the Aru-1 glacier is, however, <30 m and will only slightly affect the absolute value of the friction coefficient inferred during the instability development (see Sect. 4.2), but not its relative changes, which are the focus of this study. The assumption of no sliding should also affect the result on the Aru-2 glacier, which has a similar thermal regime, but where the no-sliding condition seems to work. This indicates the existence of different sliding conditions for the two glaciers prior to collapse, which is also supported by the friction inversion analysis presented in Sect. 4.2. In the upper parts of both glaciers, the no-sliding assumption is, however, supported by the friction inversion analysis.
4.1 Steady state configuration of the two glaciers
The Aru glaciers are representative of a cold and semi-arid climate regime, and thus would normally show little dynamic behaviour under mostly cold-ice conditions (below the pressure melting point). The steady-state equilibrium line is located around 5750 m a.s.l. (minimum glacier elevations around 5200 m a.s.l., and maximum elevations around 6100 m a.s.l.) with a maximum accumulation of 0.6 m.w.e. yr−1 at 6100 m a.s.l. and a maximum ablation of −2.5 m.w.e. yr−1 on the tongue (Fig. 4b). Both glaciers are composed of two similar catchments characterized by a smaller western branch that joins the main stream in the ablation area. The western branch of each glacier is thinner and less dynamic than the main branch that collapsed in summer 2016 (Fig. 4a). Maximum surface horizontal velocity reached 20 m yr−1 in the Aru-2 glacier, which has to accommodate higher ice flux than the Aru-1 glacier due to a wider accumulation area (1.7 km2 vs 1.2 km2) converging in a similarly narrow gorge.
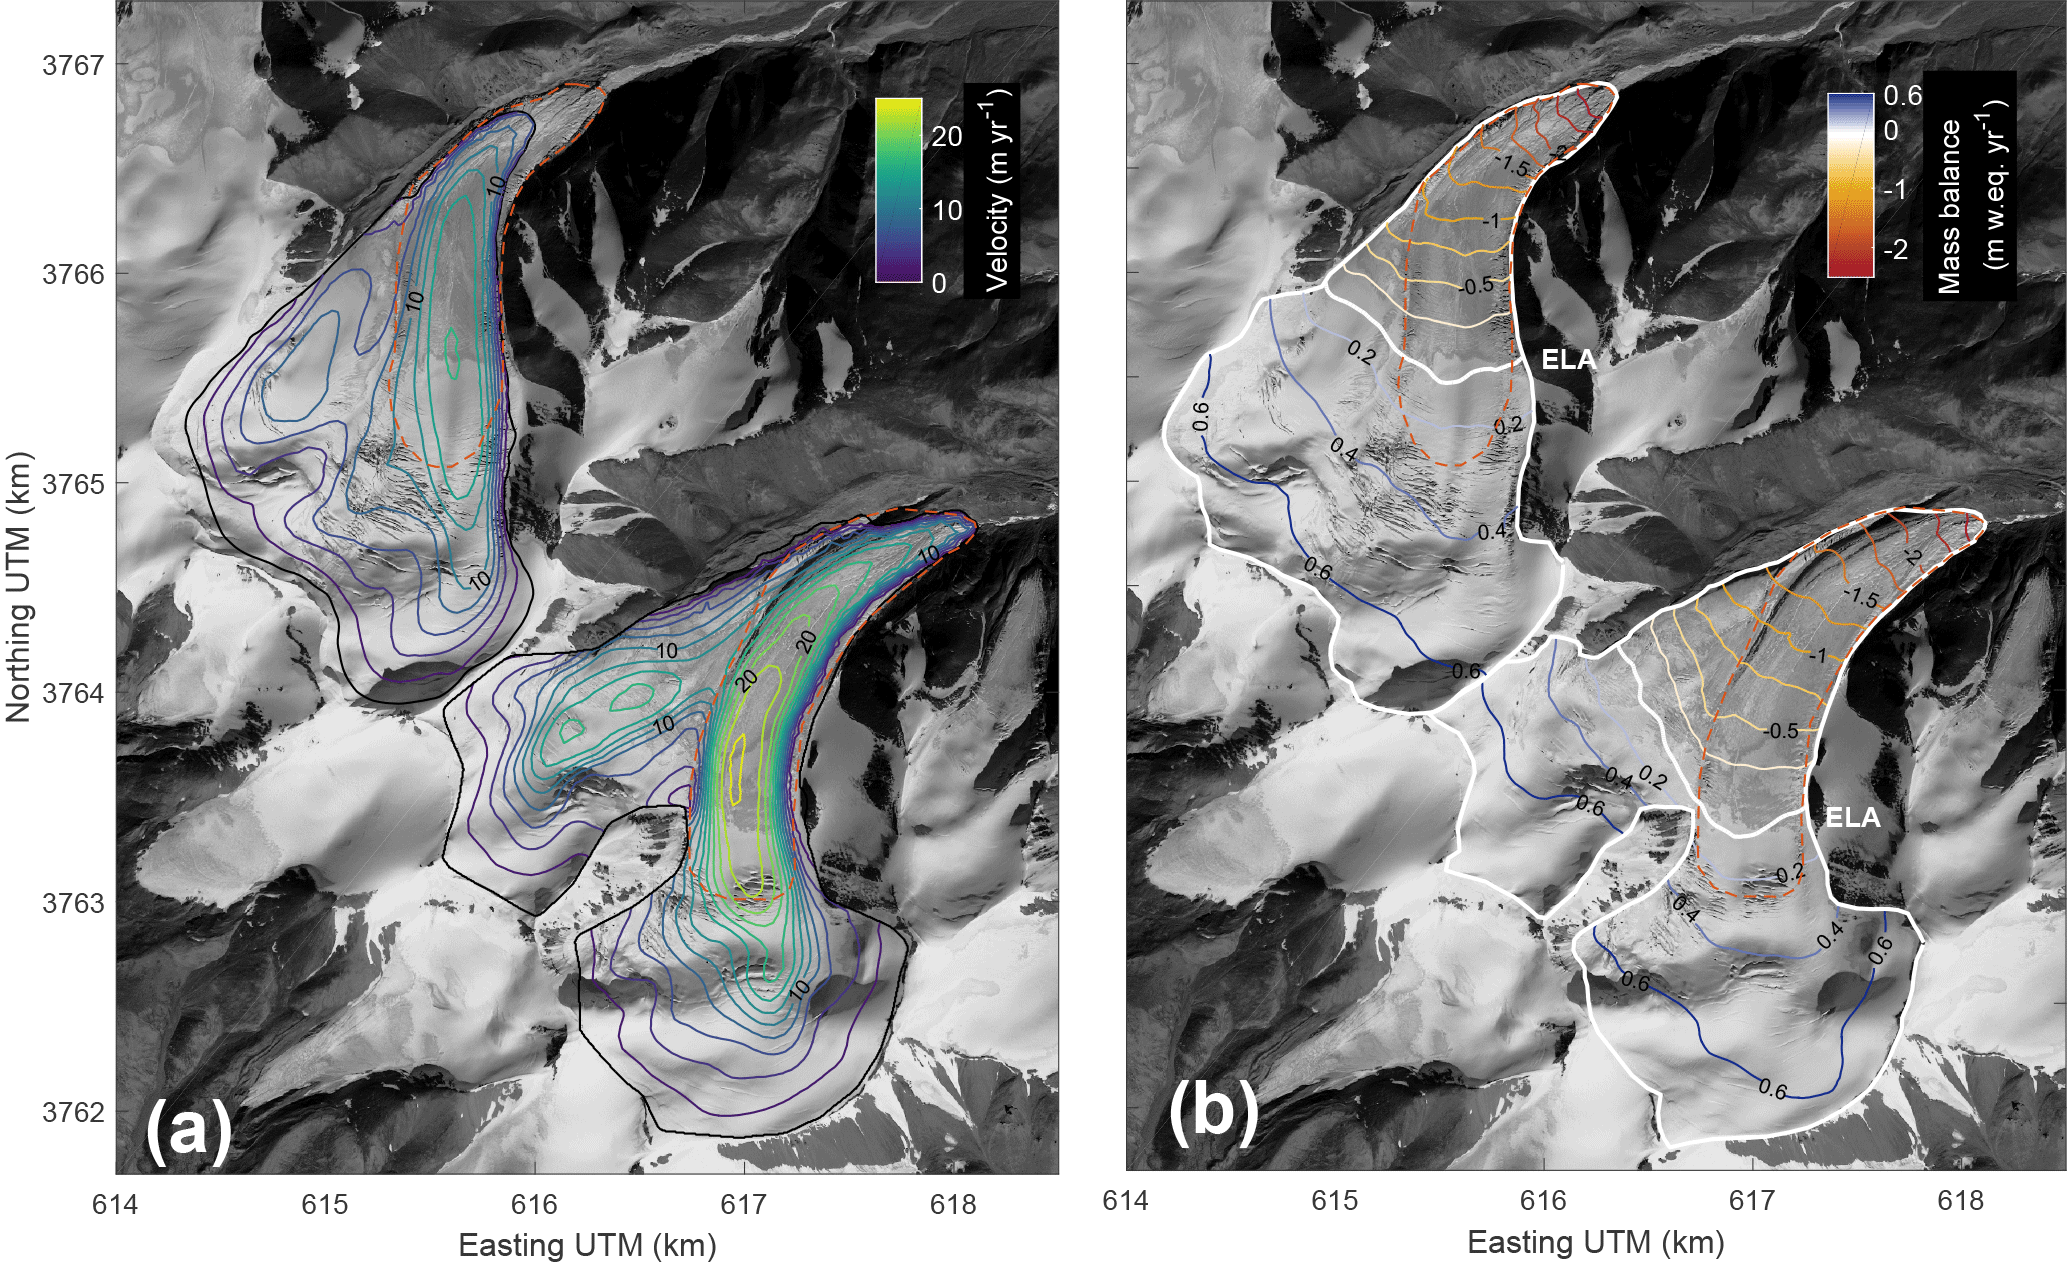
Figure 4Modelled steady-state horizontal surface velocities (a) and surface mass balance (b) for Aru-1 and Aru-2 glaciers. The black contours in (a) are modelled steady-state glacier outlines. The white contour in (b) is the glacier outline as mapped from 2015 images. Orange dashed lines indicate the detachment outline.
As previously concluded by Kääb et al. (2018), our results show that the main branches of the two glaciers are characterized by a polythermal structure with a cold accumulation zone above 5900 m a.s.l. and a temperate-based ablation area surrounded by cold ice (Fig. 5). However, through the more accurate bedrock topography derived in this study and the 3-D approach, we show here that the temperate zones likely extended into significantly larger areas beneath the detachments than previously thought. Temperate ice forms in the lower part of accumulation zones due to a significant amount of percolation and refreezing of meltwater, which increases the temperature of the near-surface firn. This warmer ice is then advected into the ablation zone contributing, together with basal heat flux, to temperate basal conditions in the lower parts of the two glaciers. Cold surface conditions due to absence of water percolation in the ablation zone (cold impermeable ice) lead to a significant cold surface layer that eventually reaches the glacier base in the shallowest zones of the glacier tongues (Fig. 5). The western branches of the two glaciers have a significantly smaller temperate area with an ablation zone that is almost entirely cold-based (Fig. 5). This thermal structure may explain why the western branches remained stable after the collapses even though each branch lost its downstream supporting buttress formed by the detached glacier tongues. The modelled spatial extent of the temperate basal ice under steady-state conditions coincides with the detached areas and indicates that friction changes leading to the collapse occurred in temperate ice rather than being produced by a change from cold to temperate thermal conditions at the glacier beds. However, the large amount of cold ice, especially along the side of the gorge, could have provided significant lateral drag that built up high driving stress, which was able to balance gravitational force under the frictional change at the temperate parts of the beds.

Figure 5Modelled steady-state temperature on the Aru-1 and Aru-2 glaciers. Left panel shows basal temperature with black hatched lines showing temperate areas. The inset highlights temperate-based (red) and cold-based (blue) areas. Orange dashed lines indicate the detachment outline. Panel (b) shows 2-D temperature profiles 1 to 6 as indicated in panel (a) (red lines). Profiles include Pléiades 2016 elevation profiles (orange lines). The dashed black lines indicate the cold-temperate transition surface. Note that vertical scale is exaggerated in profiles 1 and 4.
4.2 Basal friction change since 2011
The surge-like behaviour of the two glaciers identified from DEM comparison in Kääb et al. (2018) documents a change in the glacier dynamics during the 5 years prior to the twin collapses. By removing the elevation change due to surface mass balance we quantify the emergence velocity for constraining the basal friction parameter (Gilbert et al., 2016) for different periods: 2011–2013, 2013–2014, 2014–2015, and September–November 2015 (Table 1, Fig. 2). Our results highlight contrasting behaviour between the Aru-1 and Aru-2 glaciers, where friction decreased progressively in magnitude through time in both glaciers but over significantly different areas (Fig. 6). Frictional changes over the 5 years prior to collapse are also more significant on the Aru-1 glacier, resulting in a higher increase in surface velocity than on the Aru-2 glacier (Fig. 7). Similarly inferred friction for the Aru-2 glacier for annual means (2011–2013 and 2013–2014) and a 2-month mean (September–November 2015) indicates low seasonal variability of the basal condition. Similarly, modelled surface velocities on the Aru-1 glacier in September–November 2015 correlate well with those measured for January–April 2016 using satellite image correlation (Kääb et al., 2018) (Fig. 7f), also indicating low seasonal variability.
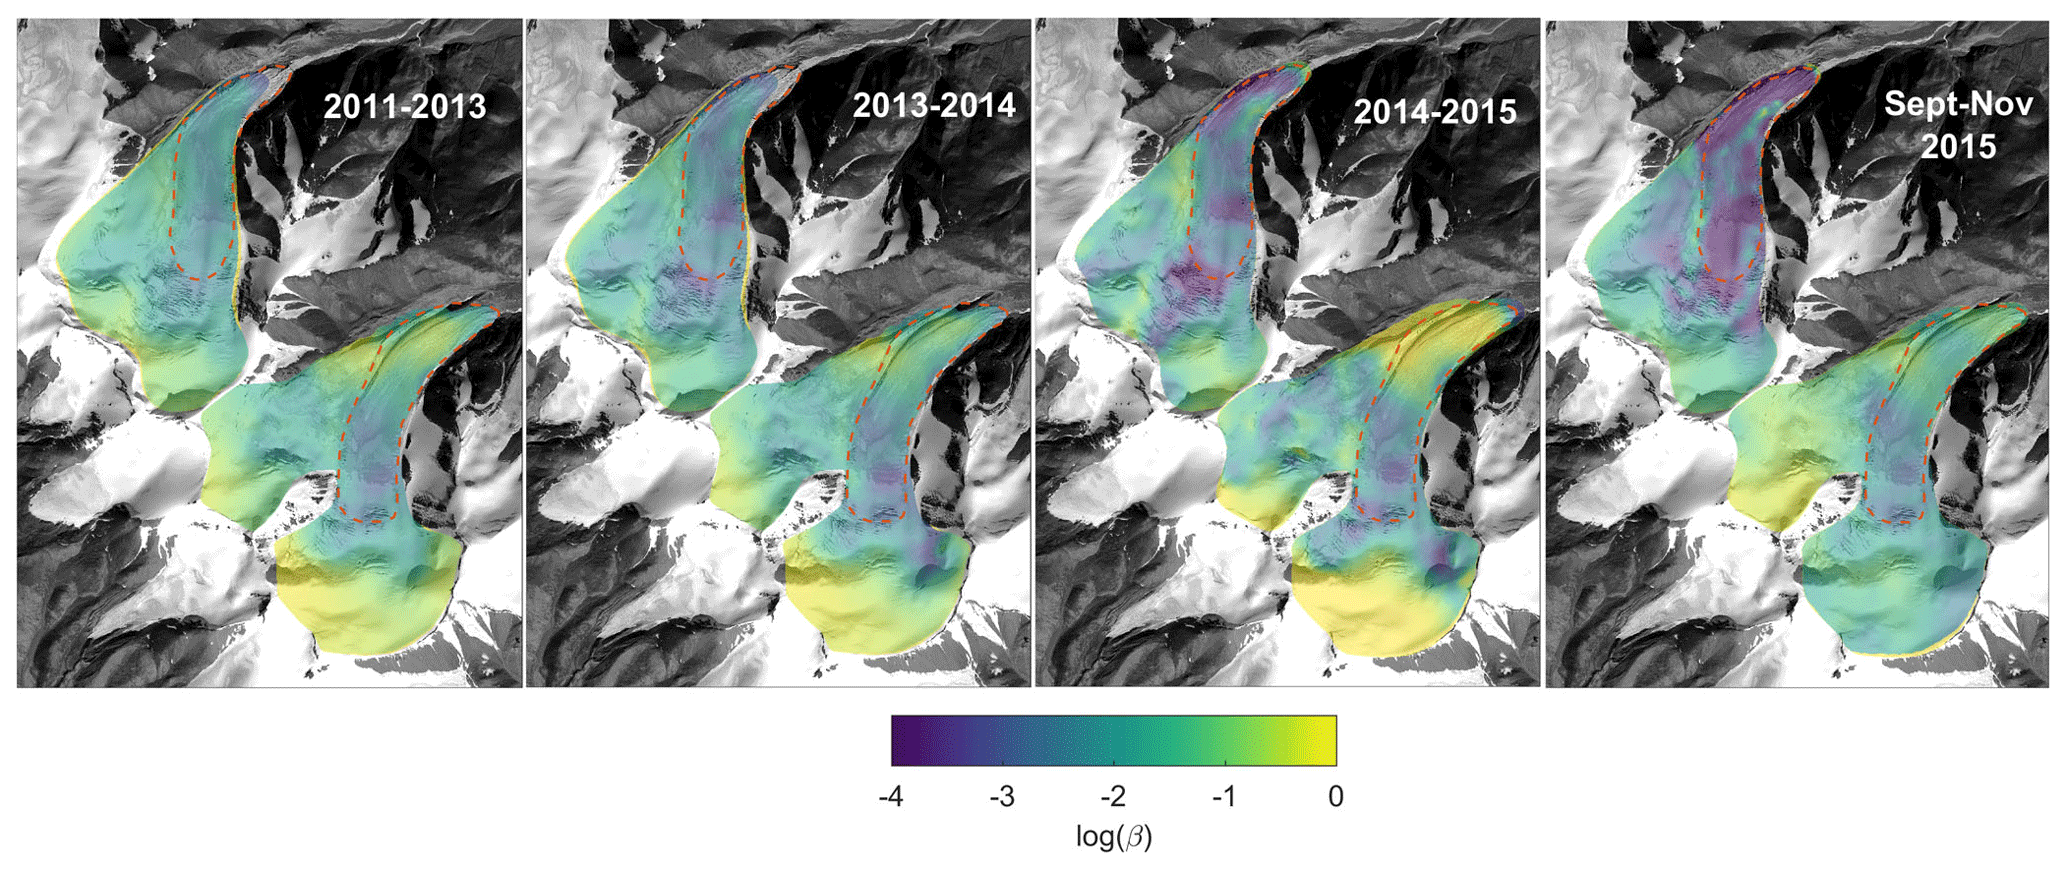
Figure 6Friction coefficient β inferred from emergence velocity during different periods prior to the collapse. Orange dashed lines indicate the detachment outline.
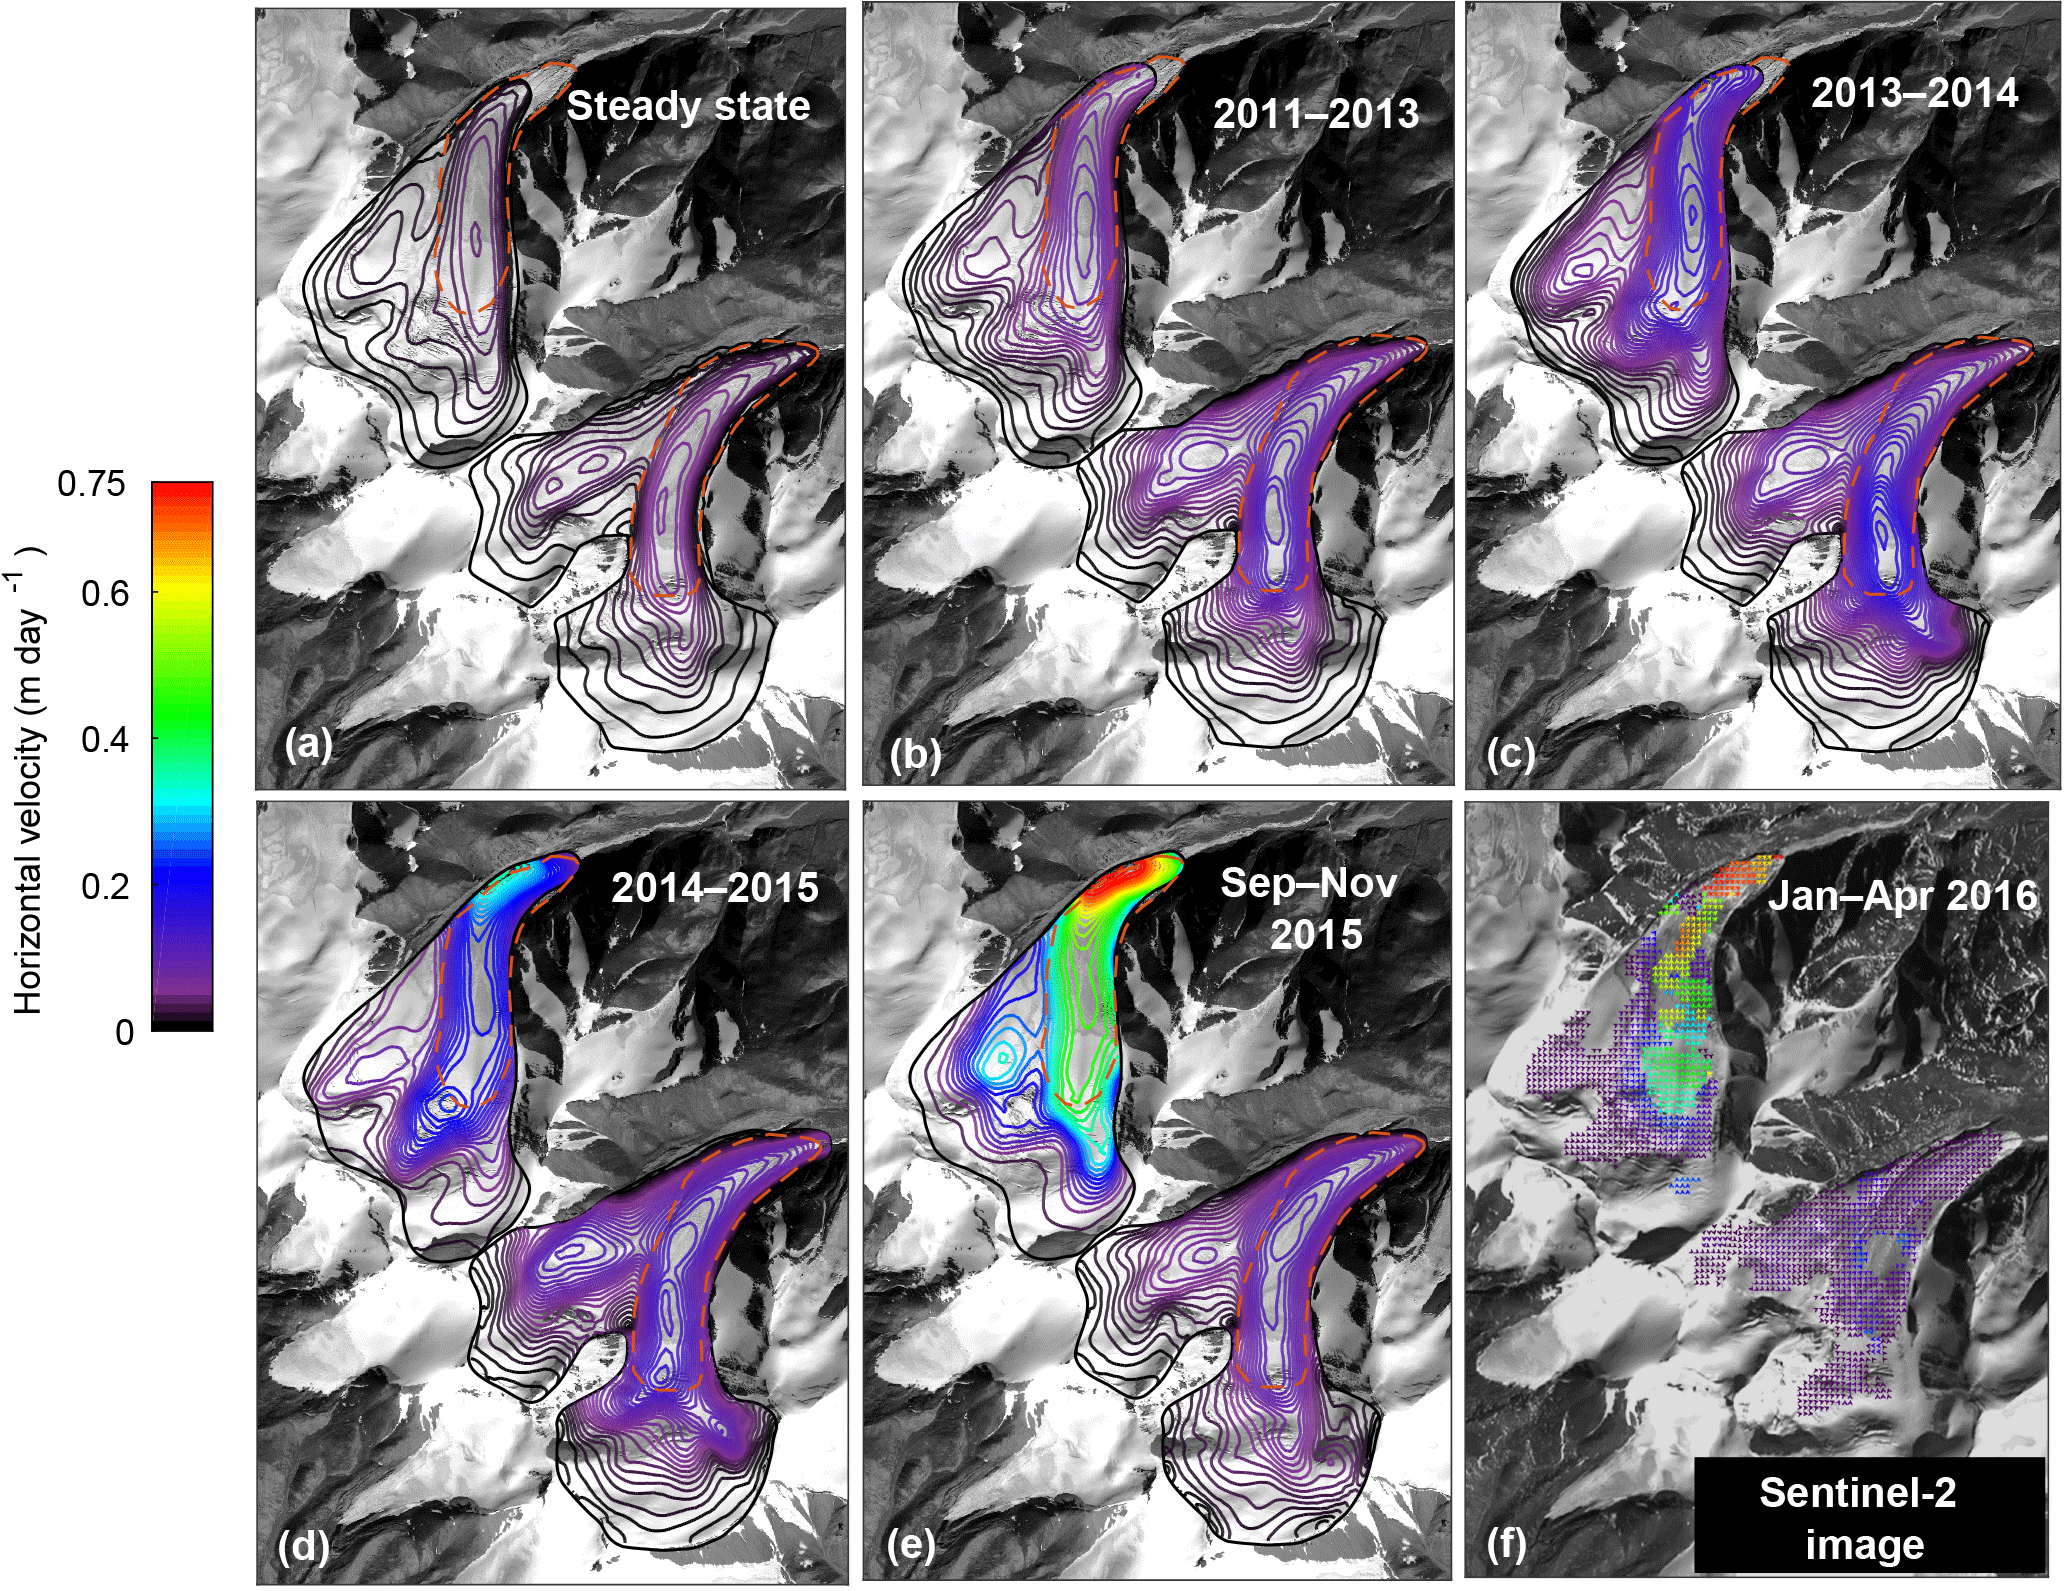
Figure 7(a–e) Modelled mean horizontal velocities for the two glaciers at steady state and for the periods 2011–2013, 2013–2014, 2014–2015, and September to November 2015. (f) Measured horizontal velocities from Sentinel-2 image correlation between January and April 2016 (adapted from Kääb et al., 2018). Orange dashed lines indicate the detachment outline.
4.3 Force balance analysis
To evaluate how resisting forces acted and evolved to balance the driving forces, we compute the mean basal shear stress during different periods from the inverse method. We therefore assume that basal shear stress is mainly constrained by the global stress balance and should not be influenced by the sliding law that we used (Eq. 1) (Joughin et al., 2004; Minchew et al., 2016). The steady-state condition shows a basal shear stress between 100 and 200 kPa in both glaciers with mean shear stresses of 137 and 150 kPa for the Aru-1 and Aru-2 glaciers (Fig. 8a). In comparison, mean driving stresses are 152 kPa (Aru-1) and 213 kPa (Aru-2), indicating that 10 % (Aru-1) and 30 % (Aru-2) of the driving force are accommodated by normal force along the sidewalls. These levels of driving stress are at the higher end of the observed range of driving stresses on mountain glaciers (Cuffey and Paterson, 2010) and reflect the presence of strong resisting forces due mainly to cold-ice conditions combined with the resistance of the valley walls.
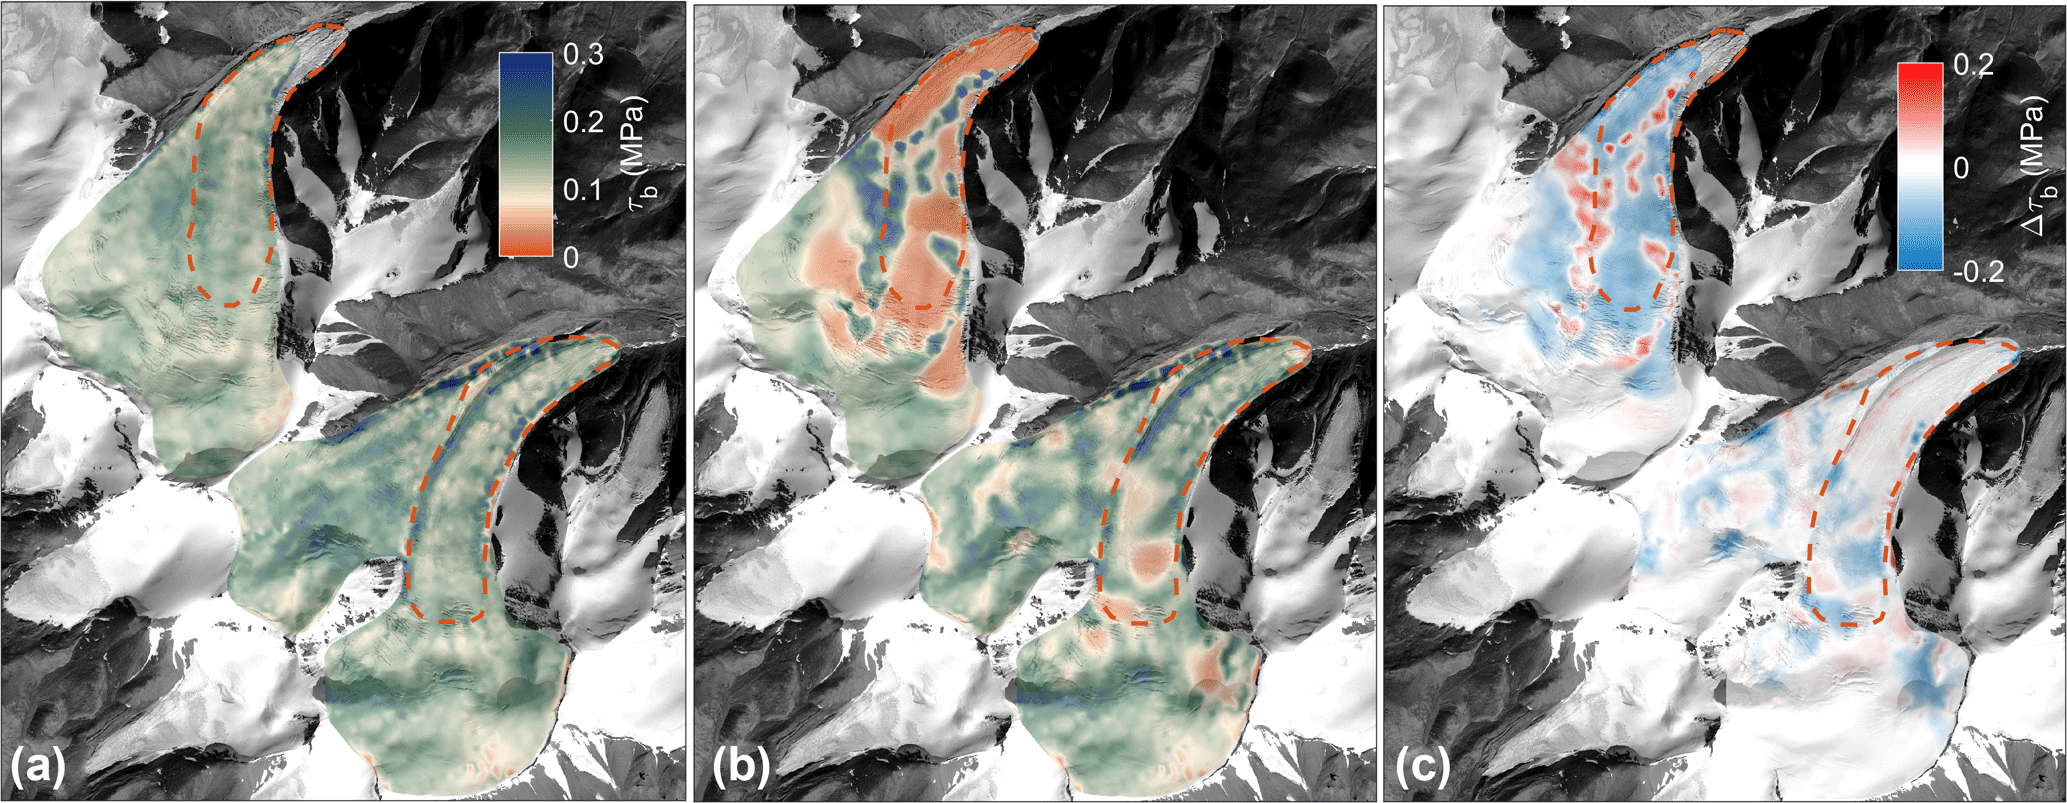
Figure 8Modelled basal shear stress at steady state (a) and in November 2015 (b). Panel (c) is the difference between (b) and (a).
The inversion of mean elevation changes between September and November 2015 (Fig. 8b) reveals that basal shear stresses on the Aru-1 glacier decreased to only 20 to 10 kPa in large areas, and basal resistance was mainly achieved by a few sticky spots (Stokes et al., 2007) in the detachment zone where shear stresses exceeded 250 kPa. Along the left bank of the glacier, close to the terminus of the Aru-1 glacier, shear stress was about 6–7 kPa and was not more than 15 kPa at the terminus. In comparison, the Aru-2 glacier behaved differently with more localized friction changes that produced a smaller change in the distribution of the basal shear stress during the same period (Fig. 8c).
The analyses of the dynamics and force-balance evolution on an area restricted to the detachment zone (dashed red lines in Fig. 8) reveal both similarities and differences between the two events (Fig. 9). Further references below to “lateral stress” apply to the detachment zone and not to the whole glacier and refer to the stress provided by the shearing interface between the stable and the unstable part of the glacier (visible in Fig. 9d). On the one hand, as already highlighted in Fig. 7, the mean detachment velocity prior to collapse behaved differently for the two glaciers (Fig. 9a). While the Aru-1 glacier detachment significantly accelerated, following behaviour typical for slope failure (Voight, 1990) over several years (blue dashed line in Fig. 9a), the Aru-2 glacier showed very little acceleration. On the other hand, force balances evolved similarly in the two detachments with a large increase in lateral stresses along the detachment margin due to both an increase in the driving stress and reduction in basal friction (Fig. 9b). Interestingly, lateral resistance overcomes basal resistance in both detachments with a delay time (81 days) close to the actual delay between the two final collapses (66 days) (Fig. 9c). On the Aru-2 glacier, it seems that smaller changes in friction were compensated by a higher change in driving stresses resulting in a similar increase in stress at the detachment margin compared to the Aru-1 glacier (Fig. 9b). The difference in surface velocity response to these similar stress transfers was a consequence of different basal drag repartitions in the two glaciers. Basal drag decreased uniformly across the entire detachment of the Aru-1 glacier with the appearance of localized sticky spots, whereas basal drag decreased only in the higher part of the detachment of the Aru-2 glacier. This led to more intense bulging and a lower velocity increase (Kääb et al., 2018) due to the high-friction patch remaining in the tongue (Fig. 6).
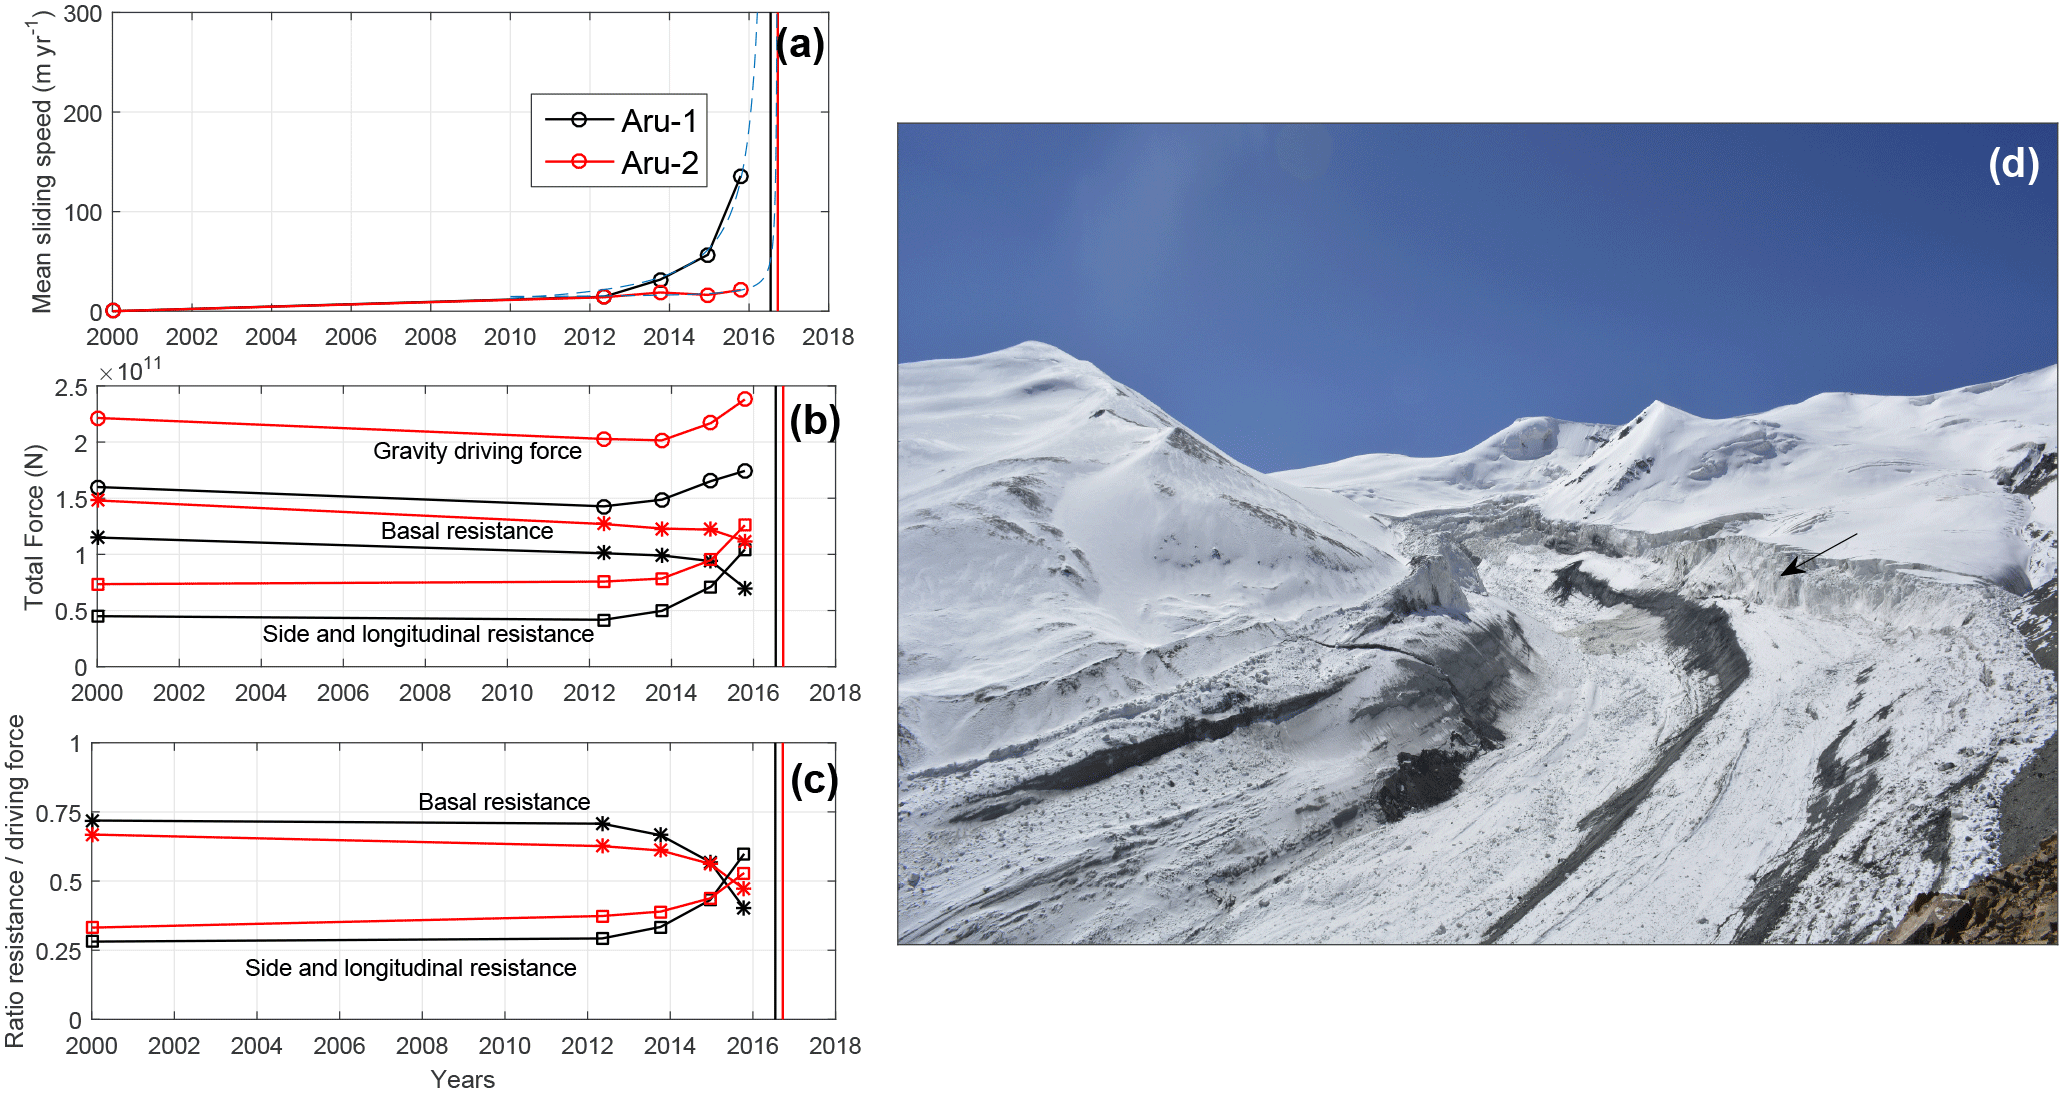
Figure 9(a) Mean sliding speed of the detachment zone for Aru-1 (black) and Aru-2 (red) glaciers. The dashed blue lines show predicted speed following an empirical law of slope failure (Voight, 1990). (b) Force balance acting on the detachment of Aru-1 (black) and Aru-2 (red). (c) Ratio of resisting force over driving force for Aru-1 (black) and Aru-2 (red). Vertical lines show collapse dates in the three panels. (d) The Aru-2 glacier detachment zone on 4 October 2016 (Picture from T. Yao). The side resistance computed in the force balance analysis arises from lateral shearing on the right side of the detachment (black arrow).
To evaluate the impact of the friction change on the mechanical property of the ice, we compute the maximal principal Cauchy stress and compare it with a threshold value set to 0.1 MPa (Krug et al., 2014) to identify the damage production (crevasse opening) (Krug et al., 2014; Pralong and Funk, 2005) (Fig. 10). The modelled stress fields clearly highlight zones where a progressive intensification of cracks opened around the detachment zone of the Aru-1 glacier (Fig. 10c) as observed on satellite images (Kääb et al., 2018); these fractures led to its final collapse. In comparison, the Aru-2 glacier again behaves differently, with less damage (cracks) that only affect the upper part of the detachment (Fig. 10c). This means that damage at the shear margin would have occurred suddenly in the Aru-2 glacier in 2016, which is confirmed by the observed sharp crack surrounding the detachment only a few days before the collapse (Kääb et al., 2018). In sum, the Aru-1 and Aru-2 glaciers underwent similar stress transfers, transitioning from basal drag to lateral shearing in their respective detachments, but showed different responses in terms of damage (i.e. crack production) and sliding speed due to different basal drag repartition. The Aru-1 glacier progressively evolved towards collapse, whereas the Aru-2 glacier accumulated stresses until a sudden release led to collapse. This indicates that critical stress transfers, precursory to such collapses, may occur without observable phenomena (i.e. surface velocity increase, crevassing) in the preceding years.
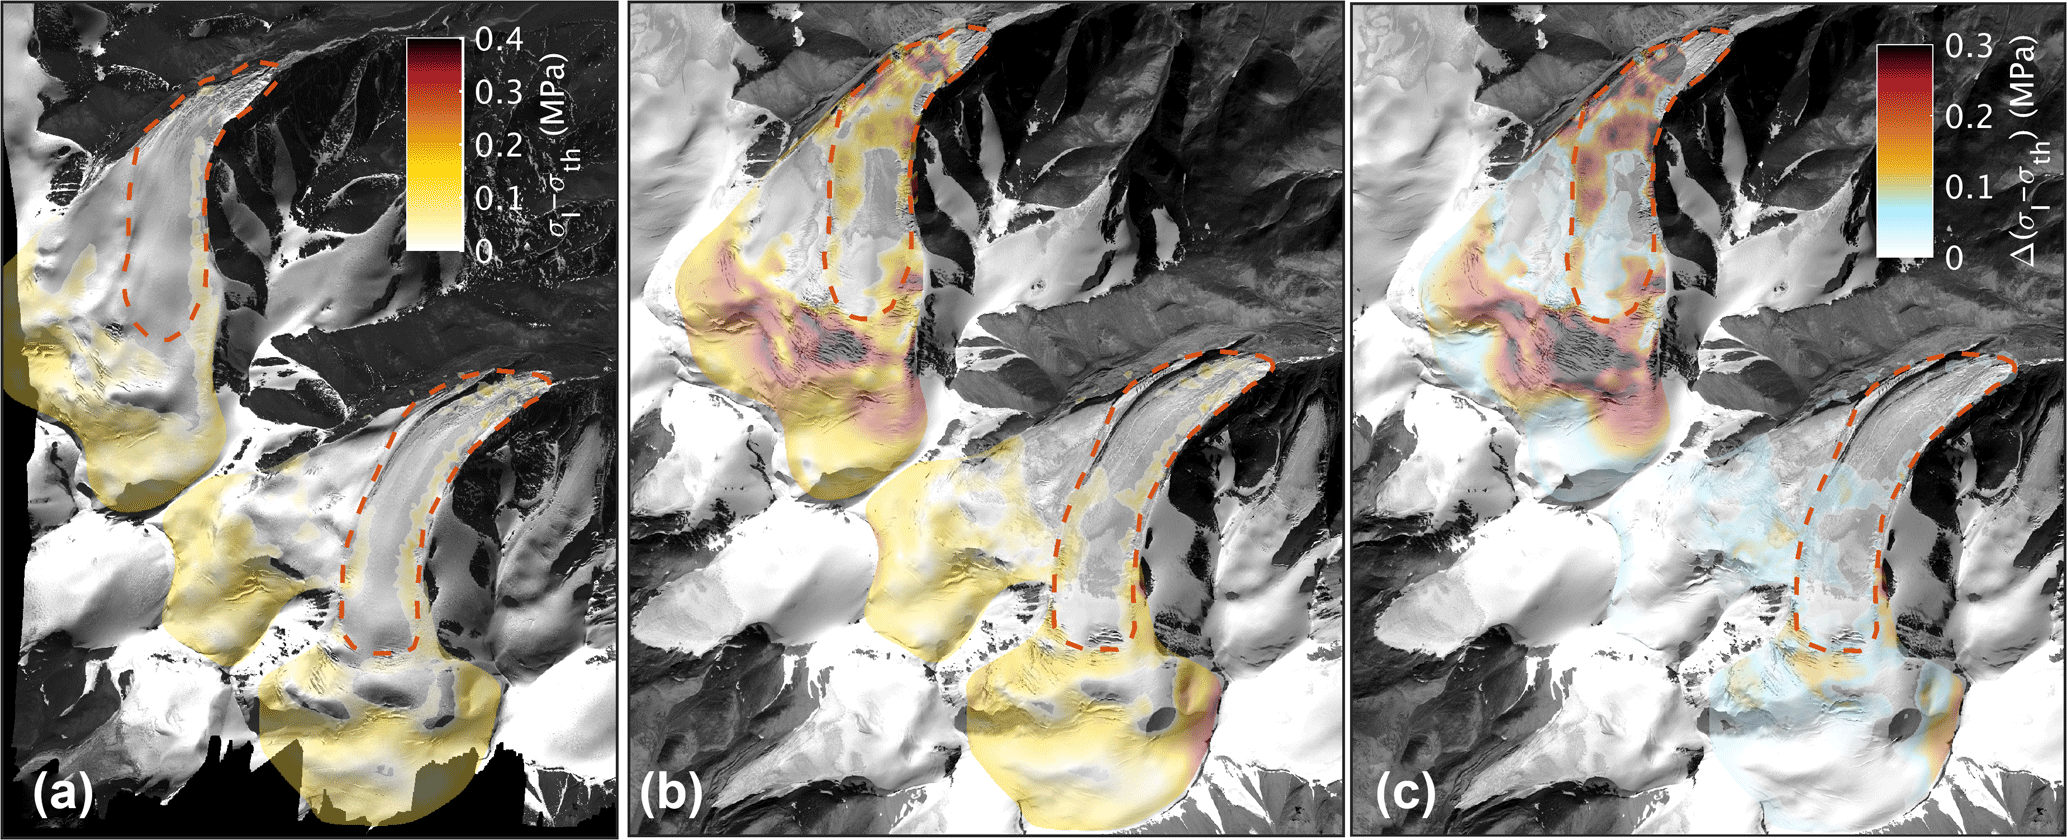
Figure 10Maximum principal Cauchy stress excess above damage initiation threshold at steady state (a) and prior to collapse (b) at the glacier surface. Panel (c) shows the difference between (a) and (b). Background image in (a) is a WorldView image from 2 December 2011 when the instability just started. Background image in (b) and (c) is a Spot 7 image from 21 September 2015, 1 year before collapse (copyright Airbus D&S). These results show a good match between predicted and observed crevasse formation in response to frictional changes.
5.1 Result uncertainties
The modelled thermal regime is sensitive to basal heat flux, which is poorly constrained. However, sensitivity tests (see Supplement, Fig. S4) show that the temperate area remains stable for a basal heat flux between and W m−2 and disappears only at W m−2. Measurements in the Guliya Ice Cap (Thompson et al., 1995) and reconstructions from Tao and Shen (2008) both give a value of W m−2, making a low value of W m−2 very unlikely. Kääb et al. (2018) have also shown that firn thickness has a great influence on the modelled thermal regime around 5900 m a.s.l. where melting occurs in the accumulation zone. Firn thickness is, however, hard to estimate without field investigation; following Kääb et al. (2018), we applied an intermediate scenario where firn thickness linearly increases from the ELA to the glacier top, where it reaches a 15 m maximum. The sensitivity test showed that only very little firn thickness (<5 m at 6000 m a.s.l.) would lead to an almost cold glacier (Supplement Fig. S5). Nevertheless, the modelled thermal regime and the friction reconstruction, which are both almost independent from each other, are in good agreement with the localization of sliding and modelled temperate areas, lending confidence in our results despite uncertainties in basal heat flux and surface boundary conditions (see Sect. 5.2).
The uncertainty in the reconstruction of basal friction mainly depends on the accuracy of measured elevation changes, which is generally higher over longer time periods (increased signal-to-noise ratio), making the 2011–2013 reconstruction the most reliable one. The measured September–November 2015 elevation change is subject to a lower signal-to-noise ratio and is thus poorly resolved in the accumulation area (see Fig. 2). However, it leaves the reconstruction reliable on the detachment area where elevation changes are much more significant. A similar conclusion applies to the 2014–2015 reconstruction, where the upper part of the glacier is affected by penetration of the X-band signal, leading to an overestimation of the emergence velocities (see Sect. 2.1). However, the influence of this uncertainty on the modelled mass balance used to compute emergence velocity is also low in the detachment zone, since elevation changes due to surface mass balance are relatively small compared to the dynamical height changes linked to the surge-like instability (<20 %) (Fig. S6). Our results are, therefore, least affected by uncertainties and most reliable in the detachment area, which is the focus of this study. In addition, bedrock topography is well constrained in the detachment areas from the post-collapse Pléiades DEM, giving additional confidence in the friction reconstruction there.
Using emergence velocities to constrain basal friction is not a commonly used method and has been successfully tested only on a slow-flowing ice cap by Gilbert et al. (2016). We therefore provide additional validation of this method in the Supplement (Figs. S7–S9) by inverting the friction on both glaciers using horizontal velocities inferred from offset tracking obtained from repeat TerraSAR-X data in December 2013. This test reveals good agreement between our emergence-based approach and the more common method based on horizontal velocities. In particular, sliding zones are similarly localized in both methods. Using the inversion based on horizontal velocities as a reference, we estimate a sliding speed magnitude accuracy of 0.036 m day−1 in the emergence-based inversion. Our additional validation test also indicates that using emergence velocities may provide for an improved constraint of the friction coefficient in accumulation areas. The reason for this is that the underlying data used in generating the emergence velocities (i.e. DEMs, modelled mass balance) are often more spatially resolved and cover larger areas on small mountain glaciers as opposed to measurements of horizontal displacements, which have problems over accumulation areas.
5.2 Frictional changes
Our results indicate that low friction below the Aru glaciers was not linked to seasonal variability of water pressure, which is often observed on glaciers elsewhere (Bartholomaus et al., 2008; Vincent and Moreau, 2016). Rather, it is likely associated with sustained change in the basal conditions caused by an accumulation of liquid water over several years prior to the collapse. Over a hard bed (Cuffey and Paterson, 2010), this would likely result in the existence of a subglacial lake, which is very unlikely here because the low friction zone on the Aru-1 glacier extended to the tongue and the lake should have drained in such a case. Furthermore, in temperate ice, high water pressure conditions are unstable over long time periods because they lead to channel formation that can efficiently drain water and decrease the pressure (Schoof, 2010). High water pressure in a cavity network would be also difficult to maintain in the Aru cases, since increasing sliding speeds tend to increase cavity size and decrease water pressure. These arguments suggest that basal friction under the Aru glaciers was probably controlled by processes associated with soft bed properties (Cuffey and Paterson, 2010).

Figure 11(a, b, c) Modelled temperate area (hatched zones) and −2 ∘C isotherm at steady state compared with sliding speeds over different periods (background colour map). (d) Comparison of sliding location for the different periods.
Comparison between sliding speed evolution and modelled basal steady-state temperature reveals a good correlation between the zones of sliding and temperate ice conditions and shows that the size of sliding areas remains similar over time (Fig. 11). This confirms that friction reduction since 2011 mainly occurred within zones that were already temperate areas, and that friction reduction is therefore not linked to a simple change from cold to temperate basal conditions. However, contrary to the Aru-1 glacier, Aru-2 appears to have been affected by a high-friction zone under its lower tongue, which the modelled basal temperatures are not able to explain as they indicate temperate, not cold conditions (Fig. 11). This zone of high friction explains the different behaviour observed from the two glaciers in terms of surface velocities and glacier advance. Indeed, a few months before the collapse, the Aru-2 glacier velocities were still low compared to the Aru-1 glacier (Fig. 7) and, while the Aru-1 glacier has advanced almost 200 m since July 2015, the front of the Aru-2 glacier remained stationary until the collapse (Kääb et al., 2018). Although the high-friction zone may have delayed the collapse of the Aru-2 glacier, it did not prevent it.
5.3 Role of the bedrock lithology and glacier till
Field observations after collapse and inspection of the detachment zones showed no presence of a hard-bed lithology beneath the glaciers, and no large boulders were observed in the forefields and avalanche deposits. Rather, extensive deposits of soft, unconsolidated and fine-grained lithologies were identified (Figs. S1–S3). We collected till samples from the Aru-1 glacier avalanche deposit and measured their grain-size distribution (Fig. 12). Mean values over the four samples in the avalanche path (Fig. 12) indicate till consisting of 14 % clay, 24 % silt, 44 % sand, and 18 % gravel. These samples are representative of the material found in the deposit and are likely also representative of the glacier till on which the glacier rested. We also observed a rather smooth-surfaced failure interface (i.e. detachment plane) suggesting a low bedrock roughness at the macro-scale (>1 m).
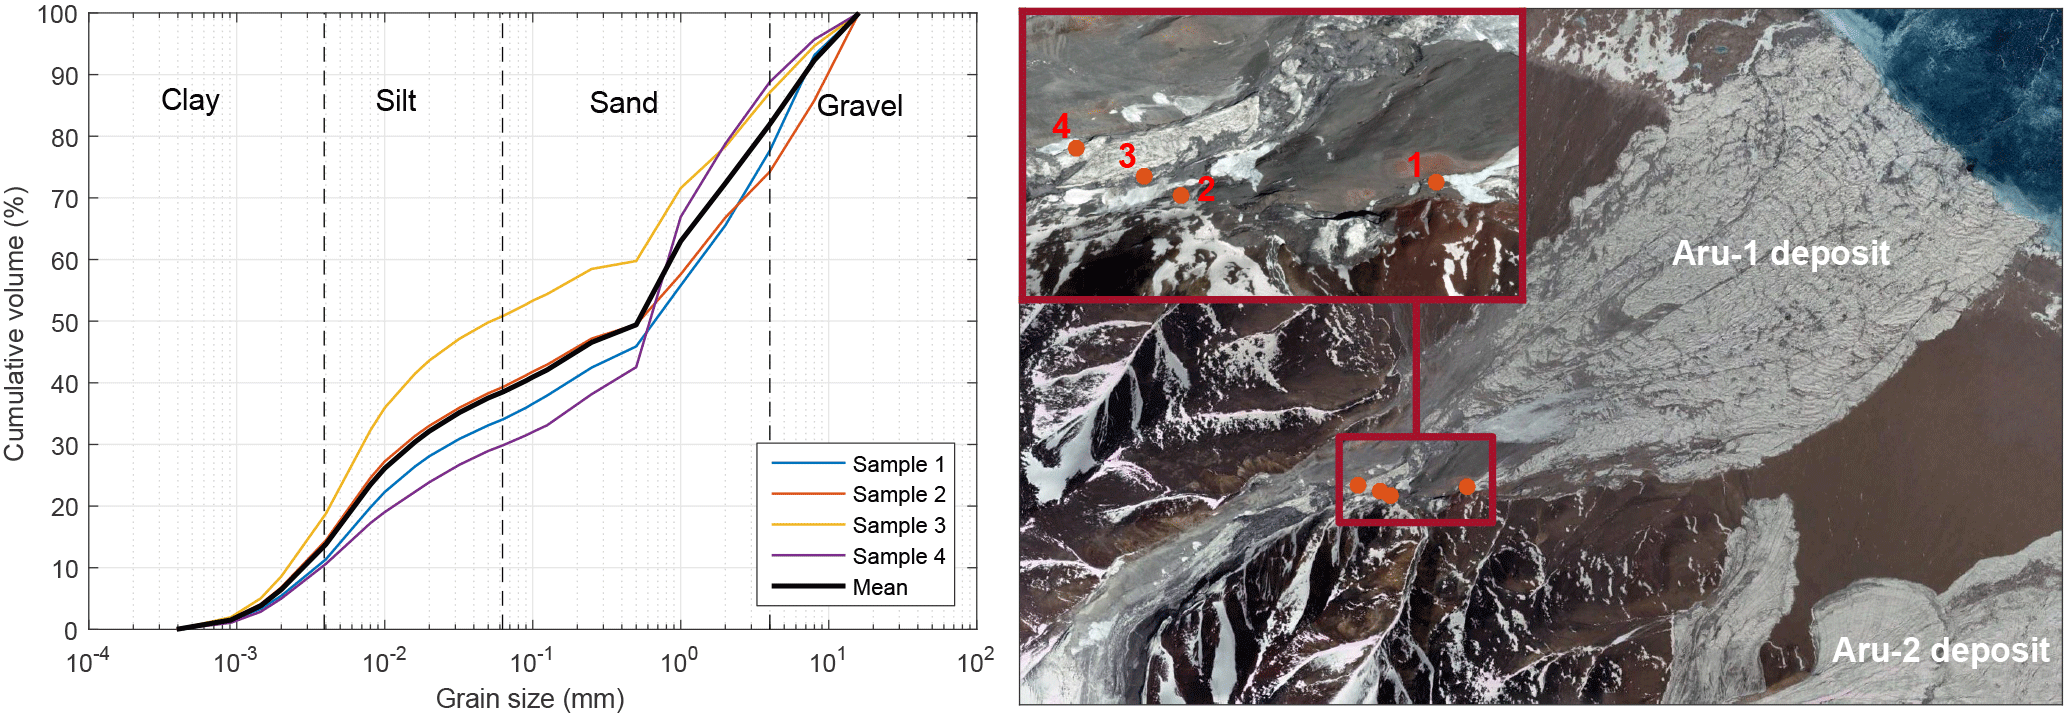
Figure 12Grain-size distribution measured in four glacier till samples collected in the Aru-1 deposit area (numbers 1 to 4 in the right panel). Background image from Google Earth.
These findings confirm that the Aru glaciers rested on a soft bed, which likely played an important role in controlling the behaviour of the glaciers from the surge initiation to the collapse. For such bed types, basal motion is not controlled by ice flow around bedrock bumps (Weertman, 1964; Lliboutry, 1968) but rather by deformation in till (Truffer et al., 2001). The sustained very low basal drag under the Aru glaciers (<20 kPa) may be similar to ice stream mechanisms whereby water-saturated till enables fast flow at low driving stresses (≈20 kPa) (Cuffey and Paterson, 2010). It has been shown that glacier till behaves with a plastic rheology with a shear strength that is strongly dependent on the effective normal stress (Iverson et al., 1998; Clarke, 2005; Iverson, 2010). The use of a linear friction law in our inversion can be viewed as a parameterization, where β includes these physics and is only valid at the time of the inversion. Therefore, the change in friction coefficient β can be interpreted in terms of a plastic till. This behaviour was found to be well described by a Coulomb-type friction law (Boulton and Jones, 1979; Clarke, 2005) as follows:
where τu is the ultimate shear strength, c is the cohesion parameter, N is the normal effective stress and φ is the friction angle. This kind of law, where shear stress is independent of the sliding velocity, allows for unstable behaviour leading to failure. In a general case, glaciers remain stable because till and water pressure are not equally distributed at the basal interface, leading to sticky spots where stress concentrates to balance gravitational forces with lateral drag at glacier margins (Cuffey and Paterson, 2010). The Aru collapses would thus be an example where basal shear stress becomes limited to till strength in such large zones that resisting forces can no longer balance gravity, eventually leading to catastrophic failure. The latter would happen for a bedrock with low roughness, which provides less vestigial resistance (surface-normal stresses) to constrain ice velocity in case of failure in the till. We propose that the change in effective normal stress due to increasing pore pressure in the till beneath the temperate zones of the Aru glaciers quickly reduced the ultimate strength of glacier till and limited the basal shear stress to a maximum value lower than the driving stress. The glacier shape could not adjust fast enough to reduce the driving stress due to strain-rate limitation in the cold-based zones, leading then to the accumulation of large stresses in the remaining sticky spots (Fig. 8) until their sudden rupture. The sticky spots were likely remnants of frozen-stiff till rather than solid rock irregularities, rendering them susceptible to failure under high stress and vulnerable to thaw from water-saturated temperate surroundings and increasing deformational heat. The high clay and silt content measured in the till is indicative of lithologies having unique low friction-angle properties (Iverson et al., 1998) and higher sensitivity of the shear strength to changes in water pressure.
One likely scenario for the development of the now collapsed Aru glaciers is that they grew in the past (pre-industrial climate) in colder conditions with low melting rates in summer, allowing for rigidity in the basal till to support high driving stress (see Sect. 4.3). The low water pressure meant that there was likely very little sliding and therefore very little production of till at that time. Upon commencement of some sliding, which may have occurred gradually over an increasing area of the bed during the past century, till production increased and the local glacier deformation regime tended to adapt to the distribution of till and liquid water reaching the bed. At this stage, percolation into the glaciers and accumulation of meltwater beneath the glaciers increased so rapidly in recent years (Kääb et al., 2018) that the glaciers could not keep balance with the changing conditions at the bed. Sliding may also have contributed to an increase in the water pressure in a positive feedback by destroying any efficient drainage system (Clarke et al., 1984). The contributory role of soft-bed lithology in the collapses is therefore likely threefold by (i) deforming with a plastic rheology when shear strength is reached, (ii) providing for low roughness at the ice-bed contact, and (iii) maintaining high water pressure, while sliding speed increases; a known process that accounts for surge behaviour (Clarke et al., 1984; Raymond, 1987; Fowler et al., 2001). High content in clay and silt probably also leads to low hydraulic conductivity favourable to higher water pressure in the till (Fowler et al., 2001).
We suggest that the existence of a high friction area under the Aru-2 glacier tongue prior to collapse is due to both higher basal normal stresses (Fig. S10), which increased the till strength, and higher lateral drag along the west side of the detachment which decreased the basal shear stresses compared to the Aru-1 glacier (Fig. 9). In this way, and contrary to the Aru-1 glacier, basal shear stress under the tongue of the Aru-2 glacier only approached the ultimate shear strength of the till just before the final collapse in response to both decreasing resistance by the lateral margin (due to crevassing) and increasing driving stresses (due to bulging).
5.4 Till-strength controlled glacier collapses
The Aru collapses, and in retrospect the Kolka Glacier collapse, define a newly recognized type of avalanching glaciers characterized by an underlying failing substrate. These ice slides could occur on glaciers with fairly low angles, therefore involving potentially large volumes of material and presenting serious consequences in terms of hazard potentials. The high sensitivity of the ultimate shear strength of the substrate to pore water pressure, combined with low bed roughness, allows for a dramatic and sustained change in basal friction conditions capable of driving this kind of instability.
The Kolka event in 2002 in the Caucasus Mountains is probably another example of this type of instability in which the maximum shear strength of the till is exceeded by a sudden increase in basal shear stress at constant effective normal stress. Indeed, during the few weeks before this collapse, significant mass was added on top of the glacier by rock and ice-fall activity, increasing basal shear and normal stresses (Huggel et al., 2005; Evans et al., 2009). This could change the surface slope, which reached the till friction angle and triggered the failure. If the till was saturated with water and had low hydraulic conductivity, increasing pore water pressure could also have compensated for the rising normal stress, keeping the normal effective stress constant. Once maximum shear strength is exceeded, failure is triggered (Evans et al., 2009). This hypothesis is plausible since Kolka Glacier is known to be a surging glacier, able to store large amounts of liquid water, and high water content and pressure were observed before its 2002 collapse (e.g. unusual ponds observed on the glacier prior to collapse) (Kotlyakov et al., 2004).
However, changes in till strength in response to changing in water pressure are likely also involved in the surge mechanisms of temperate glaciers without the large majority of surges turning into gigantic collapses. This renders sudden changes in till strength as a necessary but not fully sufficient condition, for collapses controlled by till strength. The necessary secondary condition for catastrophic failure is a sustained high driving stress with low bed roughness, coincident with weakening till. This means that the glacier has to grow over time, atop of a more stable substrate capable of supporting higher driving stresses. In particular, freezing conditions allow for the development of relatively thick glaciers on slopes that would otherwise be unable to support such high shear stress under the presence of liquid water. This makes the spatio-temporal interplay of soft-bed characteristics and the polythermal glacier regime a prerequisite of the Aru collapses, whereas for the Kolka Glacier the additional loading over a short time should have caused a fast increase in shear stress, significantly exceeding the glacier's normal conditions.
In many of the world's glacierized regions, ongoing atmospheric warming increases surface melt and the amount of water reaching glacier beds, thereby modifying the till shear strength. This development is therefore in theory capable of driving more till-strength-controlled instabilities and collapses. The most impacted glaciers would be those flowing on soft and highly erodible bed lithologies at high driving stress, particularly those with heterogeneous thermal structure (polythermal glaciers). Such glaciers are mostly localized in cold and dry climates, where a small increase in temperature results in a relatively large change in melting conditions such that the amount of water reaching the glacier base can significantly increase instability. In reality, however, an array of factors and their specific (and to this point rare) interplay in time and space are necessary to catalyse glacier collapsing as observed for the Aru and Kolka glaciers.
In summer 2016, one of the most spectacular glacier disasters ever observed occurred in western Tibet. The collapses of the twin Aru glaciers set a new reference in terms of size and mobility of glacier instabilities and required a reassessment of assumptions and conditions that more typically drive hazards and impacts linked to mountain glaciers. Using 3-D thermo-mechanical modelling together with satellite and field observations we conclude that the Aru twin collapses were driven by increasing meltwater reaching the bed in the temperate area of the polythermal structure of the glaciers, leading to the weakening of the underlying till and sediment.
Our steady-state simulation reveals that both glaciers were likely polythermal, with predominant temperate basal conditions over the detachment areas. Using satellite-observed elevation change and modelled surface mass balance, we reconstructed the frictional and shear stress regimes at the glacier base that occurred during the 5 years prior to collapse. We show that both glaciers experienced a stress transfer in their detachment area, transitioning from basal drag to lateral shearing at the detachment margin, likely beginning around 2012. However, the different spatial repartitions of basal drag in the two detachment zones led to visibly different behaviour. As early as 2015, basal drag in the Aru-1 glacier was very low over the whole detachment zone with a few remnant sticky spots where stress was concentrated. In contrast, basal drag of the southern Aru-2 glacier was distributed between a low-friction area in the upper half of the detachment zone and a high-friction area in the lower half. These circumstances led to a progressive destabilization of the Aru-1 glacier with a significant acceleration in ice flow in the detachment zone over several years prior to collapse, whereas stresses accumulated in Aru-2 until a sudden break of the shear margin occurred only a few days before the collapse.
We interpret that the change in friction was due to glacier till reaching its ultimate shear strength in response to increasing pore water pressure. This assumption is supported by field observations that revealed soft and erodible material with high clay and silt content underneath the glaciers. Plastic rheology of the till underlying the Aru glaciers combined with low bedrock roughness and polythermal glacier structure seem to be the basis of the collapses. The polythermal structure enabled the glaciers to grow at high driving stress on a partially frozen substrate, while temperate areas facilitated the water reaching the bed. Increasing water pressure in temperate areas led to failure in the till and thereby to increasing shear stresses on localized sticky spots and along the detachment margin. Due to the low bed roughness, the nature of these sticking spots seems purely thermal (cold patches). They are therefore mechanically susceptible to failure and can be affected by thermal effects such as intense deformational heat or latent heat release.
Under climatic change and related increases in surface melt rates, polythermal glaciers underlain by soft and erodible substrate are likely to destabilize more readily than hard-bed glaciers. Lower bed roughness of the former and plastic rheology of such till promotes instability, while hydrological feedbacks with high till shear rate destroying efficient drainage components (canals) lead to increasing pore water pressure and weakening substrate strength. The cases of the Aru glaciers highlight the most extreme glacier behaviour when bedrock roughness and/or frozen zones are unable to sustain global stability while the substrate is failing, leading to the catastrophic failure of large glacier sections.
The list of satellite data used is included in the Table 1. We also used Sentinel data in addition to compute velocities. Sentinel-1 and 2 are publicly available from https://scihub.copernicus.eu/ (last access: 2017). Access to all TanDEM-X data can be applied online from DLR (https://tandemx-science.dlr.de/, last access: 2017). Spot and Pléiades are commercial data which can be purchased from Airbus Defense and Space (https://www.intelligence-airbusds.com/geostore/, last access: 2017). Academic access at reduced cost exists (http://www.satelliteimageaccess.teledetection.fr/, last access: 2017). SRTM-C data are available from http://earthexplorer.usgs.gov (last access: 2017). WorldView data are commercial. Any other specific data can be provided by the authors on request.
The supplement related to this article is available online at: https://doi.org/10.5194/tc-12-2883-2018-supplement.
AG designed the study, performed the modeling and collected the till samples. SL processed the TanDEM-X data and obtained the DEMs and velocity maps. AnK processed the Spot7, SRTM and Worldview data. EB and SG processed the Pléiades data. TY organized the field trip and provided pictures and feedbacks from field observations. JK, GL and AlK proposed the idea that glacier bedrock lithology played a role in the collapse. All authors contributed to the discussion of the results. AG led the writing of the paper and all co-authors contributed to it.
The authors declare that they have no conflict of interest.
We would like to thank Irina Rogozhina and Martin Truffer for their valuable
and constructive review comments. We thank the editor, Arjen Stroeven, for his careful work. We
are further grateful to the satellite data providers: CNES for Pléiades,
Airbus/CNES for Spot 7, DLR for TanDEM-X, and Digital Globe for WorldView.
Andreas Kääb and Adrien Gilbert acknowledge the Univ. Oslo EarthFlows
initiative and funding from the European Research Council under the European
Union's Seventh Framework Programme (FP/2007-2013)/ERC grant agreement no.
320816, and Andreas Kääb also acknowledges the ESA projects Glaciers_cci (4000109873/14/I-NB) and DUE
GlobPermafrost (4000116196/15/IN-B). Simon Gascoin and Etienne Berthier
acknowledges support from the French Space Agency (CNES) and the Programme
National de Télédétection Spatiale grant PNTS-2016-01.
Tandong Yao acknowledges support from the CAS Strategic Priority Research XDA20000000. Adrien Gilbert acknowledges the
Institute of Tibetan Plateau for organizing a field trip in summer 2017, and
Mufak Said Naoroz at the Department of Geosciences, University of Oslo, for
his support with the sample analyses. Jeffrey Kargel thanks NASA (High
Mountain Asia Team) for support.
Edited by:
Arjen Stroeven
Reviewed by: Irina Rogozhina and Martin
Truffer
Aschwanden, A., Bueler, E., Khroulev, C., and Blatter, H.: An enthalpy formulation for glaciers and ice sheets, J. Glaciol., 58, 441–457, https://doi.org/10.3189/2012JoG11J088, 2012.
Bartholomaus, T. C., Anderson, R. S., and Anderson, S. P.: Response of glacier basal motion to transient water storage, Nat. Geosci., 1, 33–37, https://doi.org/10.1038/ngeo.2007.52, 2008.
Boulton, G. S. and Jones, A. S.: Stability of temperate ice caps and ice sheets resting on beds of deformable sediment, J. Glaciol., 24, 29–43, https://doi.org/10.1017/S0022143000014623, 1979.
Calonne, N., Flin, F., Morin, S., Lesaffre, B., Du Roscoat S. R., and Geindreau C.: Numerical and experimental investigations of the effective thermal conductivity of snow, Geophys. Res. Lett., 38, L23501, https://doi.org/10.1029/2011GL049234, 2011.
Clarke, G. K. C.: Subglacial Processes, Annu. Rev. Earth Pl. Sc., 33, 247–276, https://doi.org/10.1146/annurev.earth.33.092203.122621, 2005.
Clarke, G. K. C., Collins, S. G., and Thompson, D. E.: Flow, thermal structure, and subglacial conditions of a surge-type glacier, Can. J. Earth Sci., 21, 232–240, https://doi.org/10.1139/e84-024, 1984.
Cuffey, K. M. and Paterson, W. S. B.: The physics of glaciers, 4th Edn., Academic Press, Amsterdam, 2010.
Dehecq, A., Millan, R., Berthier, E., Gourmelen, N., Trouvé, E. and Vionnet, V.: Elevation Changes Inferred From TanDEM-X Data Over the Mont-Blanc Area: Impact of the X-Band Interferometric Bias, IEEE J. Sel. Top. Appl., 9, 3870–3882, https://doi.org/10.1109/JSTARS.2016.2581482, 2016.
Evans, S. G., Tutubalina, O. V., Drobyshev, V. N., Chernomorets, S. S., McDougall, S., Petrakov, D. A., and Hungr, O.: Catastrophic detachment and high-velocity long-runout flow of Kolka Glacier, Caucasus Mountains, Russia in 2002, Geomorphology, 105, 314–321, https://doi.org/10.1016/j.geomorph.2008.10.008, 2009.
Faillettaz, J., Funk, M., and Vincent, C.: Avalanching glacier instabilities: Review on processes and early warning perspectives, Rev. Geophys., 53, 203–224, https://doi.org/10.1002/2014RG000466, 2015.
Farr, T. G., Rosen, P. A., Caro, E., Crippen, R., Duren, R., Hensley, S., Kobrick, M., Paller, M., Rodriguez, E., Roth, L., Seal, D., Shaffer, S., Shimada, J., Umland, J., Werner, M., Oskin, M., Burbank, D., and Alsdorf, D.: The Shuttle Radar Topography Mission, Rev. Geophys., 45, RG2004, https://doi.org/10.1029/2005RG000183, 2007.
Fowler, A. C., Murray, T., and Ng, F. S. L.: Thermally controlled glacier surging, J. Glaciol., 47, 527–538, https://doi.org/10.3189/172756501781831792, 2001.
Gagliardini, O., Zwinger, T., Gillet-Chaulet, F., Durand, G., Favier, L., de Fleurian, B., Greve, R., Malinen, M., Martín, C., Råback, P., Ruokolainen, J., Sacchettini, M., Schäfer, M., Seddik, H., and Thies, J.: Capabilities and performance of Elmer/Ice, a new-generation ice sheet model, Geosci. Model Dev., 6, 1299–1318, https://doi.org/10.5194/gmd-6-1299-2013, 2013.
Gilbert, A., Gagliardini, O., Vincent, C., and Wagnon, P.: A 3-D thermal regime model suitable for cold accumulation zones of polythermal mountain glaciers, J. Geophys. Res., 119, 1876–1893, https://doi.org/10.1002/2014JF003199, 2014.
Gilbert, A., Vincent, C., Gagliardini, O., Krug, J., and Berthier, E.: Assessment of thermal change in cold avalanching glaciers in relation to climate warming, Geophys. Res. Lett., 42, 6382–6390, https://doi.org/10.1002/2015GL064838, 2015.
Gilbert, A., Flowers, G. E., Miller, G. H., Rabus, B. T., Van Wychen, W., Gardner, A. S., and Copland, L.: Sensitivity of Barnes Ice Cap, Baffin Island, Canada, to climate state and internal dynamics, J. Geophys. Res.-Earth, 121, 1516–1539, https://doi.org/10.1002/2016JF003839, 2016.
Gillet-Chaulet, F., Gagliardini, O., Seddik, H., Nodet, M., Durand, G., Ritz, C., Zwinger, T., Greve, R., and Vaughan, D. G.: Greenland ice sheet contribution to sea-level rise from a new-generation ice-sheet model, The Cryosphere, 6, 1561–1576, https://doi.org/10.5194/tc-6-1561-2012, 2012.
Huggel, C., Zgraggen-Oswald, S., Haeberli, W., Kääb, A., Polkvoj, A., Galushkin, I., and Evans, S. G.: The 2002 rock/ice avalanche at Kolka/Karmadon, Russian Caucasus: assessment of extraordinary avalanche formation and mobility, and application of QuickBird satellite imagery, Nat. Hazards Earth Syst. Sci., 5, 173–187, https://doi.org/10.5194/nhess-5-173-2005, 2005.
Iverson, N. R.: Shear resistance and continuity of subglacial till: hydrology rules, J. Glaciol., 56, 1104–1114, 2010.
Iverson, N. R., Hooyer, T. S., and Baker, R. W.: Ring-shear studies of till deformation: Coulomb-plastic behavior and distributed strain in glacier beds, J. Glaciol., 44, 634–642, https://doi.org/10.1017/S0022143000002136, 1998.
Joughin, I., MacAyeal, D. R., and Tulaczyk, S.: Basal shear stress of the Ross ice streams from control method inversions, J. Geophys. Res.-Sol. Ea., 109, B09405, https://doi.org/10.1029/2003JB002960, 2004.
Kääb, A., Wessels, R., Haeberli, W., Huggel, C., Kargel, J. S., and Khalsa, S. J. S.: Rapid ASTER imaging facilitates timely assessment of glacier hazards and disasters, Eos Trans. Am. Geophys. Union, 84, 117–121, https://doi.org/10.1029/2003EO130001, 2003.
Kääb, A., Leinss, S., Gilbert, A., Bühler, Y., Gascoin, S., Evans, S. G., Bartelt, P., Berthier, E., Brun, F., Chao, W., Farinotti, D., Gimbert, F., Guo, W., Huggel, C., Kargel, J. S., Leonard, G. J., Tian, L., Treichler, D., and Yao, T.: Massive collapse of two glaciers in western Tibet in 2016 after surge-like instability, Nat. Geosci., 11, 114–120, https://doi.org/10.1038/s41561-017-0039-7, 2018.
Kotlyakov, V. M., Rototaeva, O. V., and Nosenko, G. A.: The September 2002 Kolka Glacier Catastrophe in North Ossetia, Russian Federation: Evidence and Analysis, Mt. Res. Dev., 24, 78–83, https://doi.org/10.1659/0276-4741(2004)024[0078:TSKGCI]2.0.CO;2, 2004.
Krug, J., Weiss, J., Gagliardini, O., and Durand, G.: Combining damage and fracture mechanics to model calving, The Cryosphere, 8, 2101–2117, https://doi.org/10.5194/tc-8-2101-2014, 2014.
Lliboutry, L.: General theory of subglacial cavitation and sliding of temperate glaciers, J. Glaciol., 7, 21–58, 1968.
Minchew, B., Simons, M., Björnsson, H., Pálsson, F., Morlighem, M., Seroussi, H., Larour, E., and Hensley, S.: Plastic bed beneath Hofsjökull Ice Cap, central Iceland, and the sensitivity of ice flow to surface meltwater flux, J. Glaciol., 62, 147–158, https://doi.org/10.1017/jog.2016.26, 2016.
Pralong, A. and Funk, M.: Dynamic damage model of crevasse opening and application to glacier calving, J. Geophys. Res.-Sol. Ea., 110, 1978–2012, https://doi.org/10.1029/2004JB003104, 2005.
Raymond, C. F.: How do glaciers surge? A review, J. Geophys. Res.-Sol. Ea., 92, 9121–9134, https://doi.org/10.1029/JB092iB09p09121, 1987.
Schoof, C.: Ice-sheet acceleration driven by melt supply variability, Nature, 468, 803–806, https://doi.org/10.1038/nature09618, 2010.
Stokes, C. R., Clark, C. D., Lian, O. B., and Tulaczyk, S.: Ice stream sticky spots: A review of their identification and influence beneath contemporary and palaeo-ice streams, Earth-Sci. Rev., 81, 217–249, https://doi.org/10.1016/j.earscirev.2007.01.002, 2007.
Tao, W. and Shen, Z.: Heat flow distribution in Chinese continent and its adjacent areas, Prog. Nat. Sci., 18, 843–849, https://doi.org/10.1016/j.pnsc.2008.01.018, 2008.
Thompson, L. G., Mosley-Thompson, E., Davis, M. E., Lin, P. N., Dai, J., Bolzan, J. F., and Yao, T.: A 1000 year climate ice-core record from the Guliya Ice Cap, China: its relationship to global climate variability, Ann. Glaciol., 21, 175–181, https://doi.org/10.3189/S0260305500015780, 1995.
Tian, L., Yao, T., Gao, Y., Thompson, L., Mosley-Thompson, E., Muhammad, S., Zong, J., Wang, C., Jin, S., and Li, Z.: Two glaciers collapse in western Tibet, J. Glaciol., 63, 194–197, https://doi.org/10.1017/jog.2016.122, 2016.
Truffer, M., Echelmeyer, K. A., and Harrison, W. D.: Implications of till deformation on glacier dynamics, J. Glaciol., 47, 123–134, 2001.
van Pelt, W. J. J., Oerlemans, J., Reijmer, C. H., Pettersson, R., Pohjola, V. A., Isaksson, E., and Divine, D.: An iterative inverse method to estimate basal topography and initialize ice flow models, The Cryosphere, 7, 987–1006, https://doi.org/10.5194/tc-7-987-2013, 2013.
Vincent, C. and Moreau, L.: Sliding velocity fluctuations and subglacial hydrology over the last two decades on Argentière glacier, Mont Blanc area, J. Glaciol., 62, 805–815, https://doi.org/10.1017/jog.2016.35, 2016.
Voight, B.: Materials science laws applies to time forecast of slope failure, in Proceedings 5th International Symposium on Landslides, Lausanne 1988, 3, 1471–1472, C. Bonnard, A. A. Balkema, Lisse, Netherlands, 1990.
Weertman, J.: The theory of glacier sliding, J. Glaciol., 5, 287–303, 1964.