the Creative Commons Attribution 4.0 License.
the Creative Commons Attribution 4.0 License.
 | 20 Feb 2019
Identifying and improving AGU collaborations using network analysis and scientometrics
Sarah Hasnain
Ronie Stephan
The American Geophysical Union (AGU) is an Earth and space science professional society based in the United States. Research conducted by AGU members ranges from the Earth's deep interior to the outer planets of our solar system. However, little research exists on the AGU meeting itself. In this work, we apply network analysis and scientometrics to 17 years of AGU Fall Meetings. We are interested in the AGU network structure and what its properties can tell us about how the procedures of the AGU Fall Meeting can be enhanced to facilitate better scientific communication and collaboration. We quantify several network properties and illustrate how this type of analysis can enhance meeting planning and layout. We conclude with practical strategies for the AGU Program Committee.
- Article
(1441 KB) - Full-text XML
-
Supplement
(6225 KB) - BibTeX
- EndNote


The American Geophysical Union (AGU) is an Earth and space science professional society based in the United States. The AGU publishes scientific journals, sponsors meetings, and supports education and outreach efforts to promote public understanding of science. Research conducted by AGU members ranges from the Earth's deep interior to the outer planets of our solar system. Despite the American in its name, roughly 40 % of the AGU's membership comes from outside of the U.S.1
Each year, the AGU hosts a Fall Meeting that draws tens of thousands of participants. The research presented at these meetings has been discussed and debated extensively. However, little research exists on the AGU meeting itself. In this work, we apply network analysis and scientometrics to 17 years of AGU Fall Meetings. We model the AGU Fall Meetings as graphs in which presentation co-authors are connected nodes and analyze these graphs to ascertain their structure and properties. We are interested in what the structure and network properties can tell us about the scientometrics of the AGU.
Scientometrics is the science of measuring and analyzing science itself, such as a discipline's structure, growth, change, and interrelations (Hood and Wilson, 2001). Vassily Nalimov first coined the term in the 1960s and subsequent work has focused on a discipline's methodologies and principles as well as individual researchers' scientific output (Braun et al., 2006; Hirsch, 2005). Here, we are using “scientometrics” in the general sense of “the science of science” to understand how science operates and can be improved. Our work is an exploration of possible approaches to developing scientometrics within the Earth and space sciences. We are interested in how science collaboration and networking are taking place and how the procedures of the AGU Fall Meeting could be enhanced to facilitate better scientific communication and collaboration. We provide suggestions on how our work can be operationalized; however, we are currently not at an operational stage.
2.1 Dataset
The data in this study came from the AGU Abstract Browser (http://abstractsearch.agu.org/about/, last access: 6 September 2018). The Abstract Browser is a publicly available database of historical abstracts presented at AGU meetings. This database contains abstracts from meetings other than the Fall Meeting, such as the Ocean Sciences Meetings; however, we limited our study to Fall Meetings only. The Fall Meetings are multidisciplinary and provide the largest most comprehensive subset of data available. Restricting our study to Fall Meetings provides the most data and also ensures equal coverage of the sub-domains covered by the AGU. Our study includes 17 years of data and covers the Fall Meetings from 2000 to 2017.
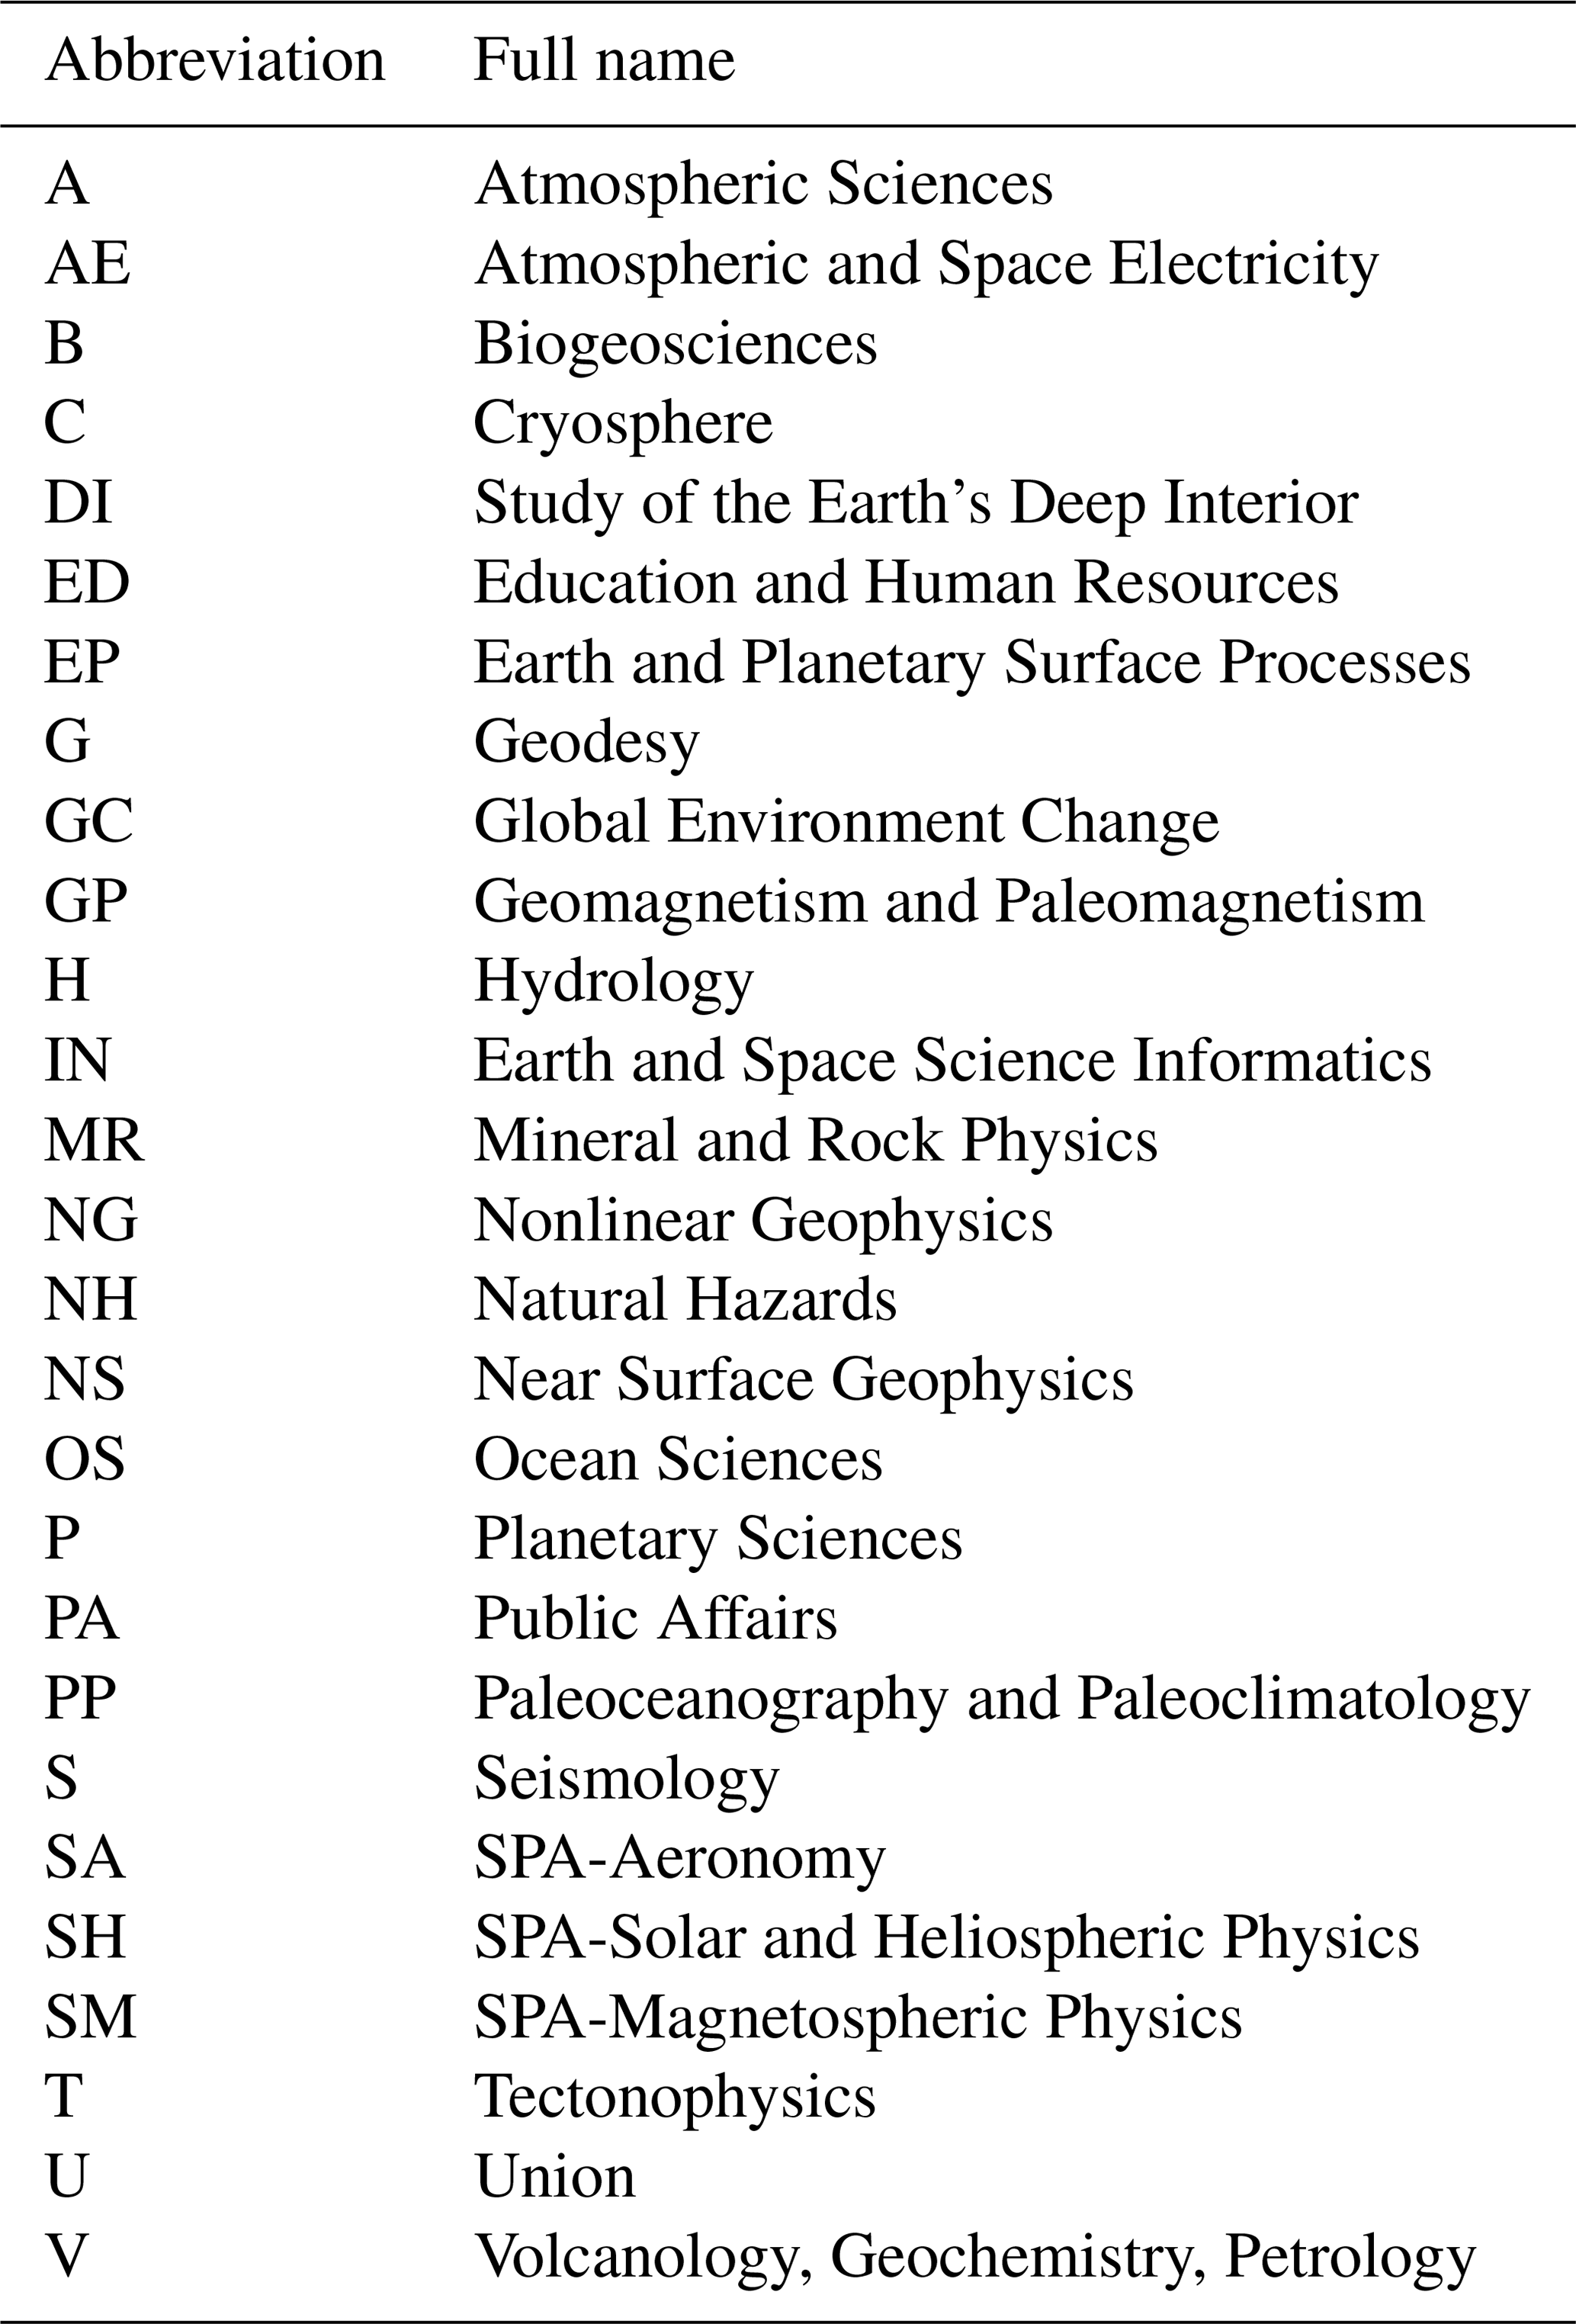
The AGU is divided into sections representing the subdisciplines of Earth and space science. As science evolves over the years, new sections are formed, and older ones can be merged or dissolved. The sections on which we had data to perform our analysis are listed in Table 1.
Data were retrieved by programmatically querying the AGU Abstract Browser's Linked Open Data interface (http://abstractsearch.agu.org/about/lod, 6 September 2018; http://abstractsearch.agu.org:8890/sparql, 6 September 2018). Linked Open Data (LOD, Berners-Lee, 2006; Bizer et al., 2009) are part of the methods and tools collectively known as the Semantic Web (Hitzler et al., 2010), which aim to bring machine-readable meaning to the Web through common data formats, exchange protocols, and computational reasoning. The LOD methodology has become a widely adopted data sharing format and, at last count (Hogan et al., 2011), roughly 30 billion semantic statements were available on the emerging “Web of Data”. In 2012 the AGU's historical abstracts were converted to LOD (Narock et al., 2012; Rozell et al., 2012), with new meeting data being added each year.
2.2 Limitations and assumptions
The Abstract Browser contains Fall Meeting data such as sessions held, presentations given in each session (including title, authors, affiliations, and an abstract), and the AGU section in which the session was held. However, the author data contain only email address, last name, and initials. Moreover, the same author sometimes has only a first initial, while other times having first and middle initials. The first author of this study is a prime example. He appears in the abstract database as both: T. W. Narock and T. Narock. This raises significant challenges for autonomously disambiguating people. Further complicating this issue is the case where authors change institutions. For example, T. Narock appears with his graduate school email address and later with the email address of his affiliation post-graduation. Each author does have an organizational affiliation provided; however, these data are also messy and difficult to use for disambiguation. There is no standard naming convention and the same institution often appears with multiple names. For example, the NASA Goddard Space Flight Center is listed as NASA/Goddard, NASA/GSFC, and NASA/Goddard Space Flight Center. Ideally, authors would be listed with their ORCID (Haak et al., 2012); however, at present, such data are not available via any public AGU interface that we are aware of. Lacking the means to perform a large-scale crowdsourced disambiguation project, we sought other means to disambiguate authors.
We considered email address to be a unique and distinguishing feature. Our disambiguation efforts consisted of finding all cases where email address and last name were the same but initials only partially matched. For example, [T. Narock, tom.narock@gsfc.nasa.gov] was considered the same person as [T. W. Narock, tom.narock@gsfc.nasa.gov]. This approach identified 56 155 matches, which we corrected in our dataset. However, there are likely many other authors who were not disambiguated. We identified an additional 19 896 cases where last names matched, initials were a partial match, and email addresses differed (e.g., [T. W. Narock, tom.narock@gsfc.nasa.gov] and [T. Narock, tnarock@ndm.edu]). Many of these people are likely the same (the example given here is known to be the same); however, in the vast majority of cases we have no means of knowing for sure and have chosen not to claim these authors as identical. Thus, our results have an inherent uncertainty to them. Specifically, the network graphs we construct from the AGU data likely have multiple nodes representing the same person. As such, we consider the network analysis portion of our study a lower limit. We know that the actual values for network density and connected components are not lower than the values reported here, and they would likely be a bit higher had we been able to uniquely identify all authors in our dataset. Despite this limitation, we feel our analysis can still provide useful insights into the AGU meetings.
All networks are comprised of nodes (also called vertices) and edges (connections between the nodes). Networks also come in multiple types ranging from directed to undirected. Twitter is an example of a directed network. Edges have directionality in a directed network. For example, Twitter user A can follow user B; however, user B is not obligated to follow user A back. The edge between users A and B would have directionality. In an undirected network all edges are bidirectional by default. This is how “friending” works in Facebook. Both users (nodes) must agree to the “friendship” and a link (edge) is created. There are no directed edges allowed in an undirected network.
We model each AGU section as an undirected network based on co-authorship. If A co-authored a presentation with B and C, then A, B, and C become nodes in the network with bidirectional links between each (e.g., A–B, A–C, B–C). We do not apply any weighting to the edges. If authors A and B co-authored a presentation at the 2000 Fall Meeting and then again at the 2010 Fall Meeting, this adds no new information to the graph. We also consider edges to be eternal when studying the temporal evolution of the network. For example, if authors A and B co-authored a presentation at the 2000 Fall Meeting, these nodes and edges persist in 2017 even if those authors never co-authored another presentation. We also note that we are measuring co-authorship and not necessarily collaboration. Our dataset does not contain references and acknowledgements used in presentations. These secondary connections (e.g., citing a paper or acknowledging a discussion) do not show up as edges in our graphs.
2.3 Open-source software
The analysis software used in this study is freely and publicly available from Narock and Hasnain (2019). The graph data generated from our software are available in Narock et al. (2018)
3.1 Network density
Network density is defined as the ratio of actual connections to possible connections. Possible values for network density range from 0 (no connections at all) to 1 (everyone is connected to everyone else). Figure 1 illustrates the concept of network density on sample networks. In panel (a) of Fig. 1 there are three nodes and three potential connections. These three potential connections are realized as all nodes are connected to each other. This is representative of the AGU case in which A, B, and C have co-authored presentations with each other, although not necessarily the same presentation. The network in Fig. 1a has a density of .
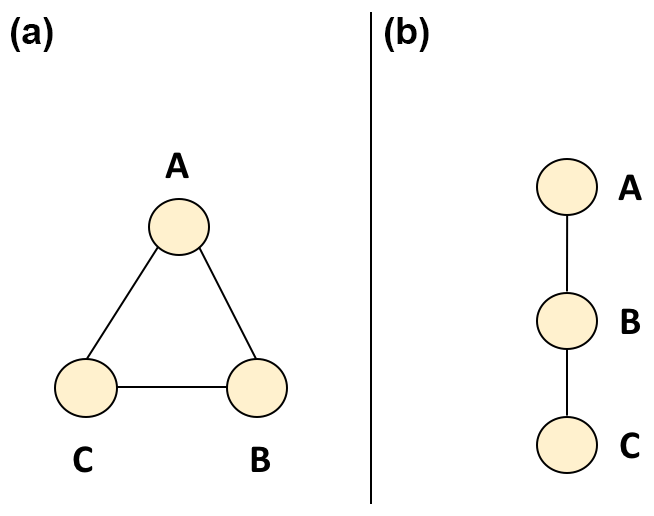
The network shown in Fig. 1b has the same three potential connections. However, only two of the nodes are directly connected. In this example, A has co-authored a presentation with B and B has co-authored a presentation with C; however, A has not co-authored a presentation with C. The network in Fig. 1b has a density of .
It is unlikely that a real-world network such as the AGU would have the network density of Fig. 1a. Given the diversity of research topics it is unlikely that the network would be completely connected. But what are the actual density values and how do they change over time?
To answer these questions, we first considered each AGU section to be its own network. Yearly network graphs were then created for each section using the Abstract Browser data. Next, we computed the percentage change in network density for each section. We note that percentage change values do not always encompass the entire 17 years of the data. For example, the Earth and Space Science Informatics (IN) section did not come into existence until 2005. Percentage change was computed using the first year in which we had data and 2017. Results are shown in Fig. 2.
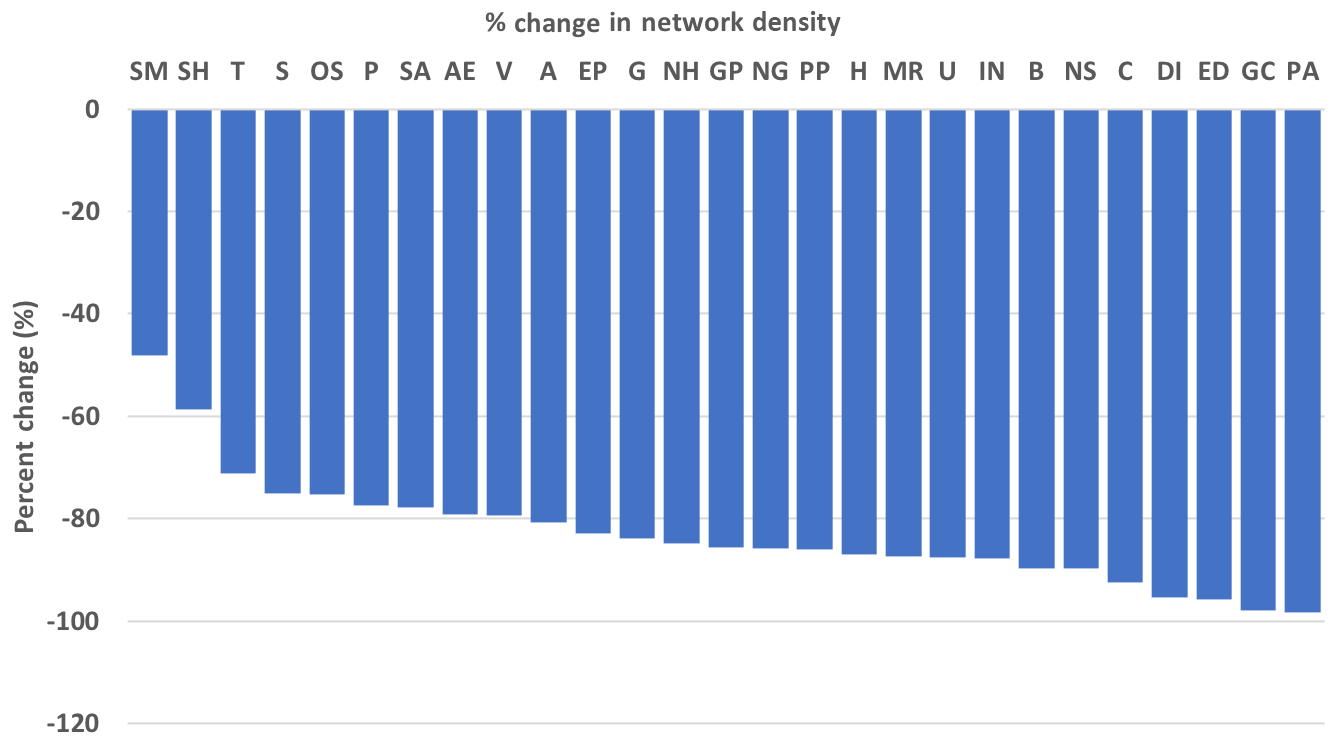
Network density decreases for all sections. This tells us that nodes are being added faster than edges. In practical terms, the rate at which new people (nodes) are attending AGU sessions is greater than the rate at which continuing attendees (nodes) are making new connections. Again, these percentage change values should be considered a lower limit given our inability to completely disambiguate the authors in our data.
We expect network density to decrease over time. For density to remain constant, each new node must also be accompanied by an even larger number of new edges. However, we are surprised by the extent to which density is decreasing. If a large number of new collaborations were being found at the AGU, then existing nodes would have new edges at a rate comparable to new nodes being added. This appears to not be the case.
3.2 Connected components
In graph theory, a connected component of an undirected graph (also referred to as a component) is a subgraph within the whole graph. Figure 3 shows an example. The network in the figure is comprised of three connected components. Although not shown here, an isolated node not connected to any other nodes in the network is also considered a connected component. Analysis of connected components within the AGU networks gives us an indication of how fragmented the networks are.
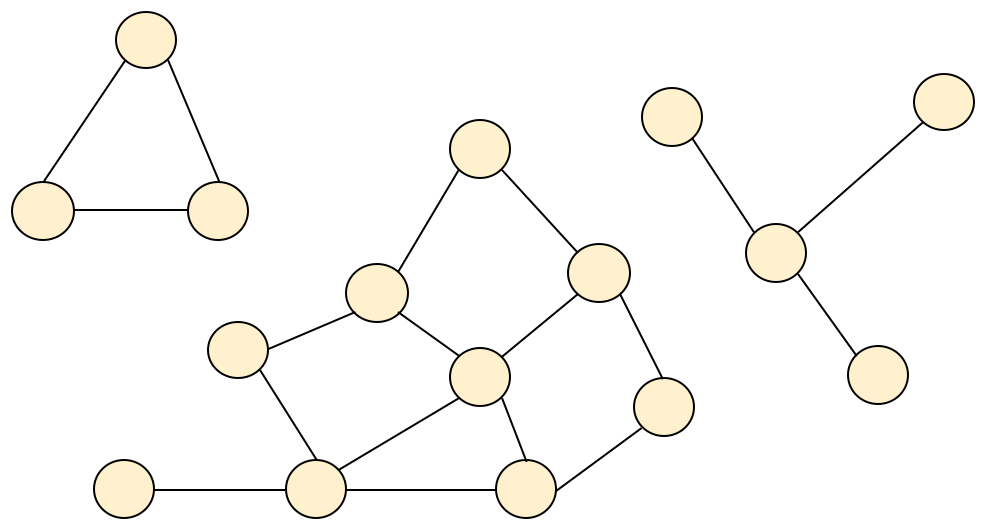
Table 2 lists the connected components of the AGU section graphs. Specifically, we combined all 17 years of data for each section and computed the number of connected components for the section, the percentage of the total nodes that make up the largest component, and the percentage of components comprised of a single node. Sections in Table 2 are ordered by decreasing size (number of nodes).
Table 2Connected components of AGU section graphs (sorted by network size).
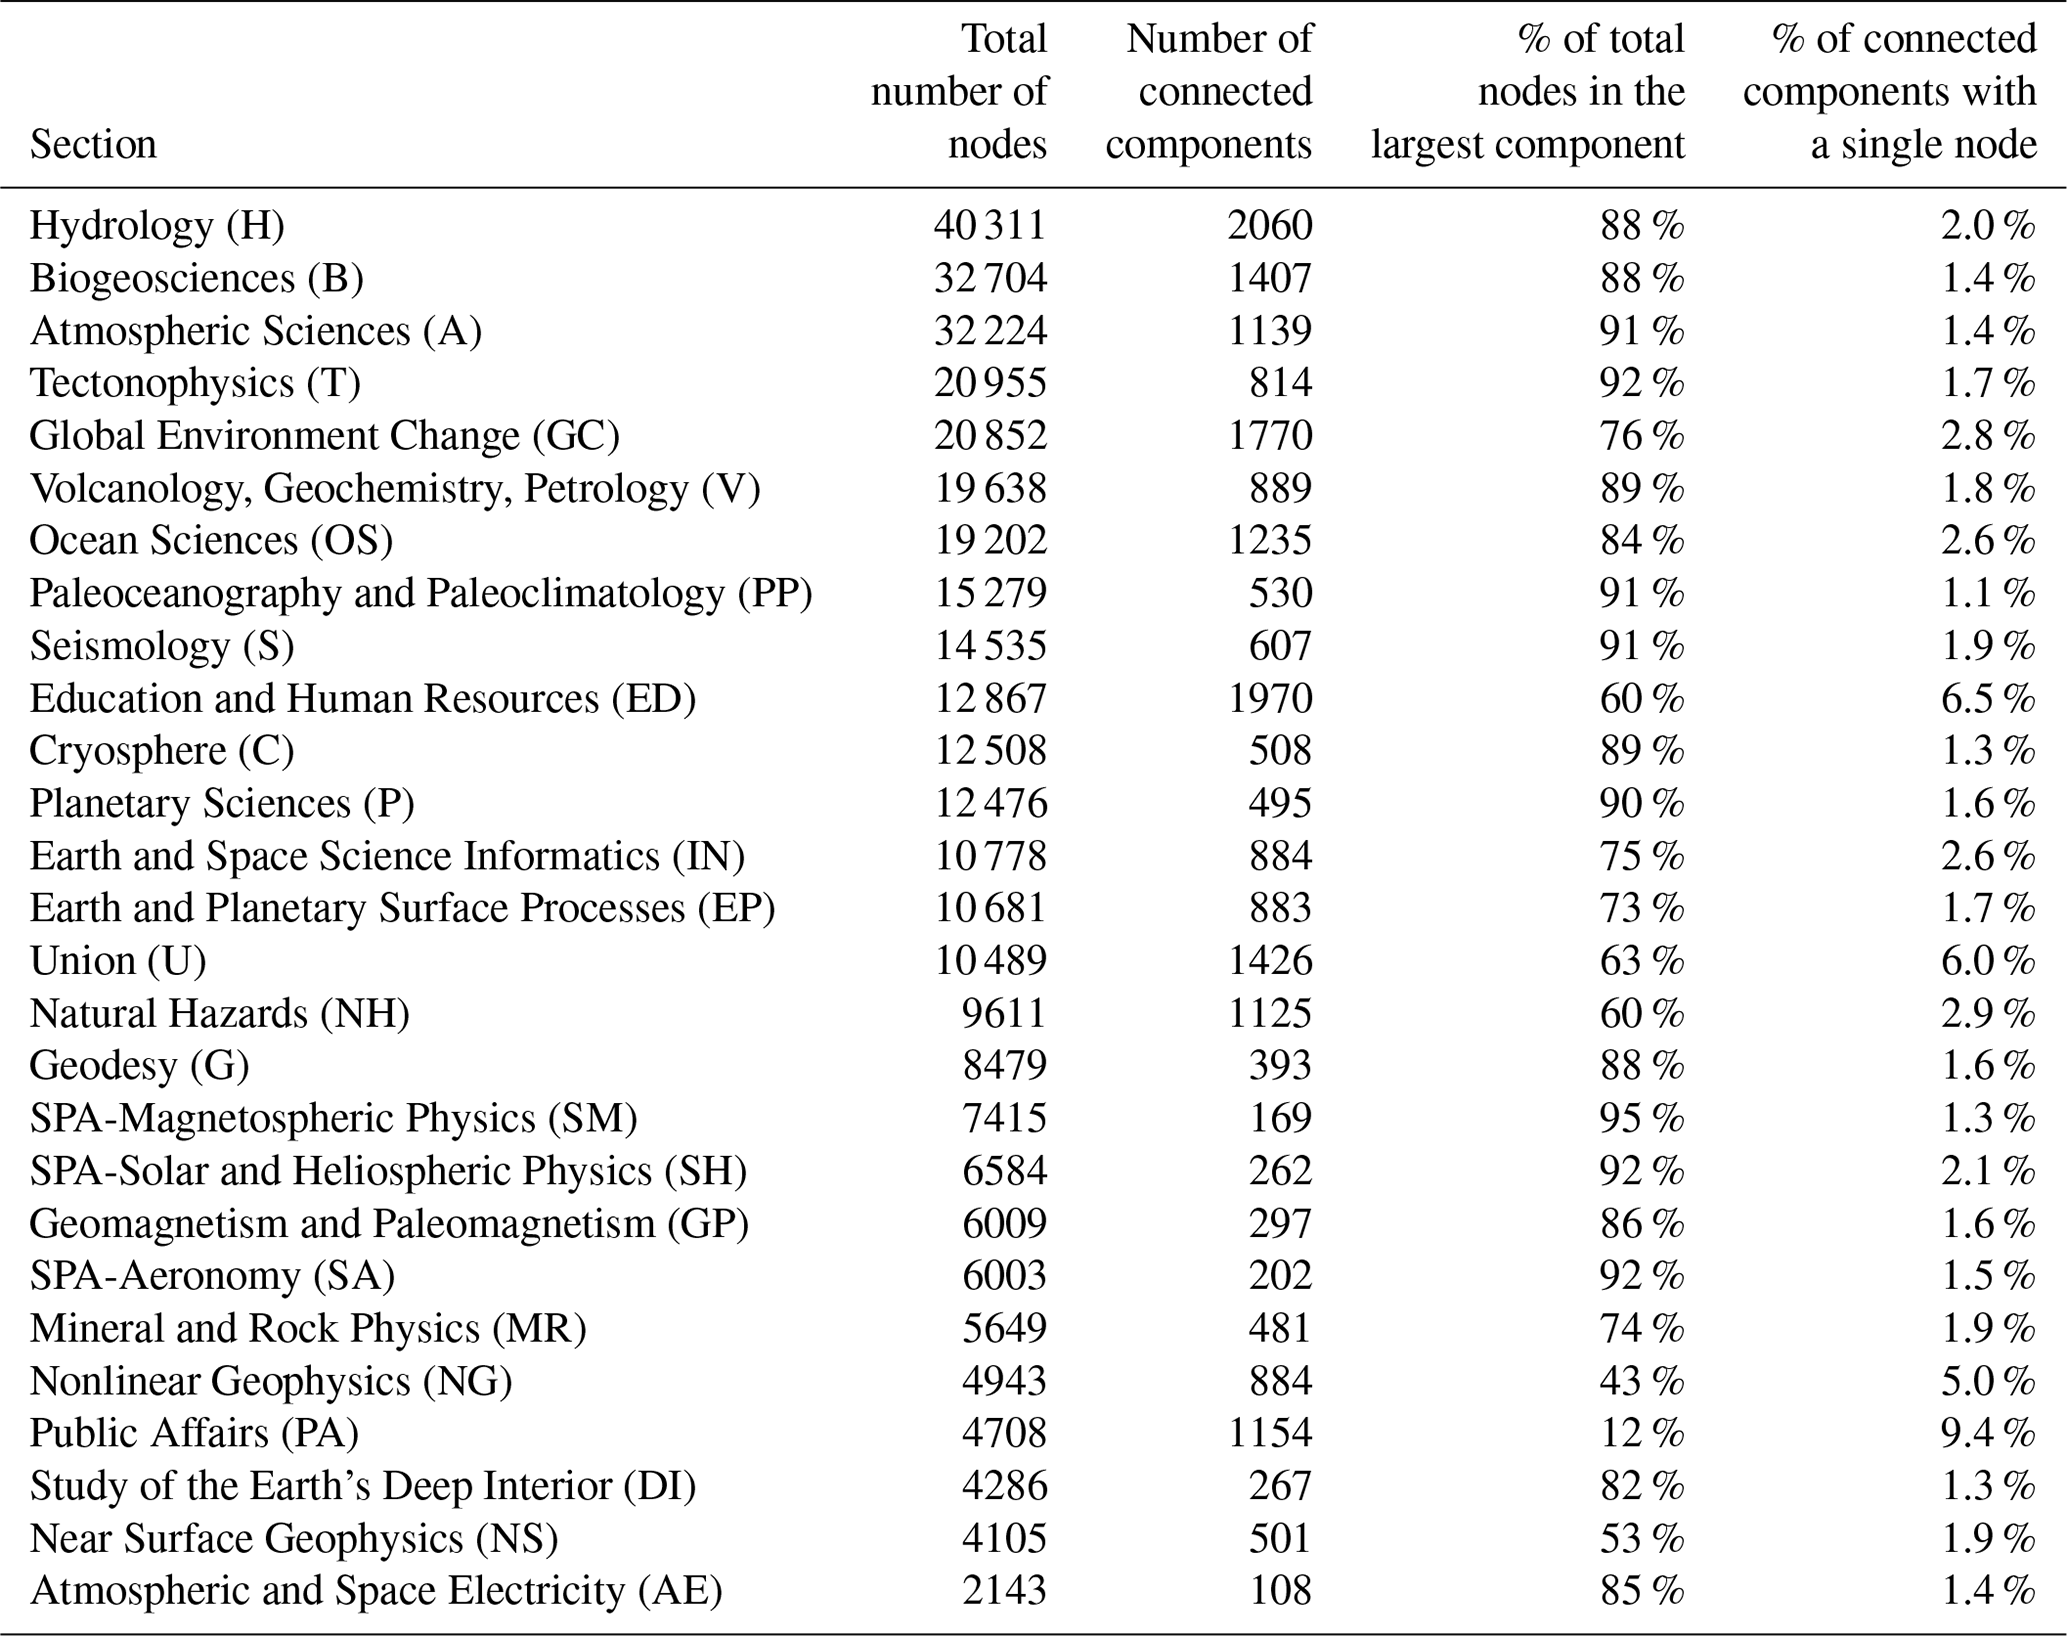
The diversity of research topics likely guarantees that we are going to have some fragmentation of the network. Not everyone is working on the same topic and we would expect to see the number of connected components greater than 1. Moreover, there is nothing wrong with working by oneself, and single-node components are to be expected. However, quantifying these network features helps in the development of geoscience communication strategies. From Table 2 we see that the majority of available nodes are part of the largest connected component. This is true regardless of section size. The only notable exceptions are Public Affairs and Nonlinear Geophysics. Similarly, we see a very small percentage of single-node components. Notable exceptions here are Public Affairs, Education, and Union. Public Affairs, Education, and Union often have contributions from other sections, which likely accounts for the increased fragmentation and single-node components, although the Nonlinear Geophysics result is surprising and in need of further research.
3.3 Multidisciplinary authors
We define a multidisciplinary author as anyone who appears in the network graph of more than one AGU section. We looked at all pair-wise comparisons of sections and obtained the results in Fig. 4, which shows the number of unique authors who have appeared in both sections over the 17 years of data. We account for differences in section size by normalizing the data. The fractional values shown in Fig. 4 are the number of authors presenting in both sections divided by the combined sizes of both sections. For instance, there nearly 8000 individuals who presented in both Biogeosciences (B) and Hydrology (H) during the time period 2000 to 2017. The B–H entry in Fig. 4 is this 8000 value divided by the total number of nodes in B and H.
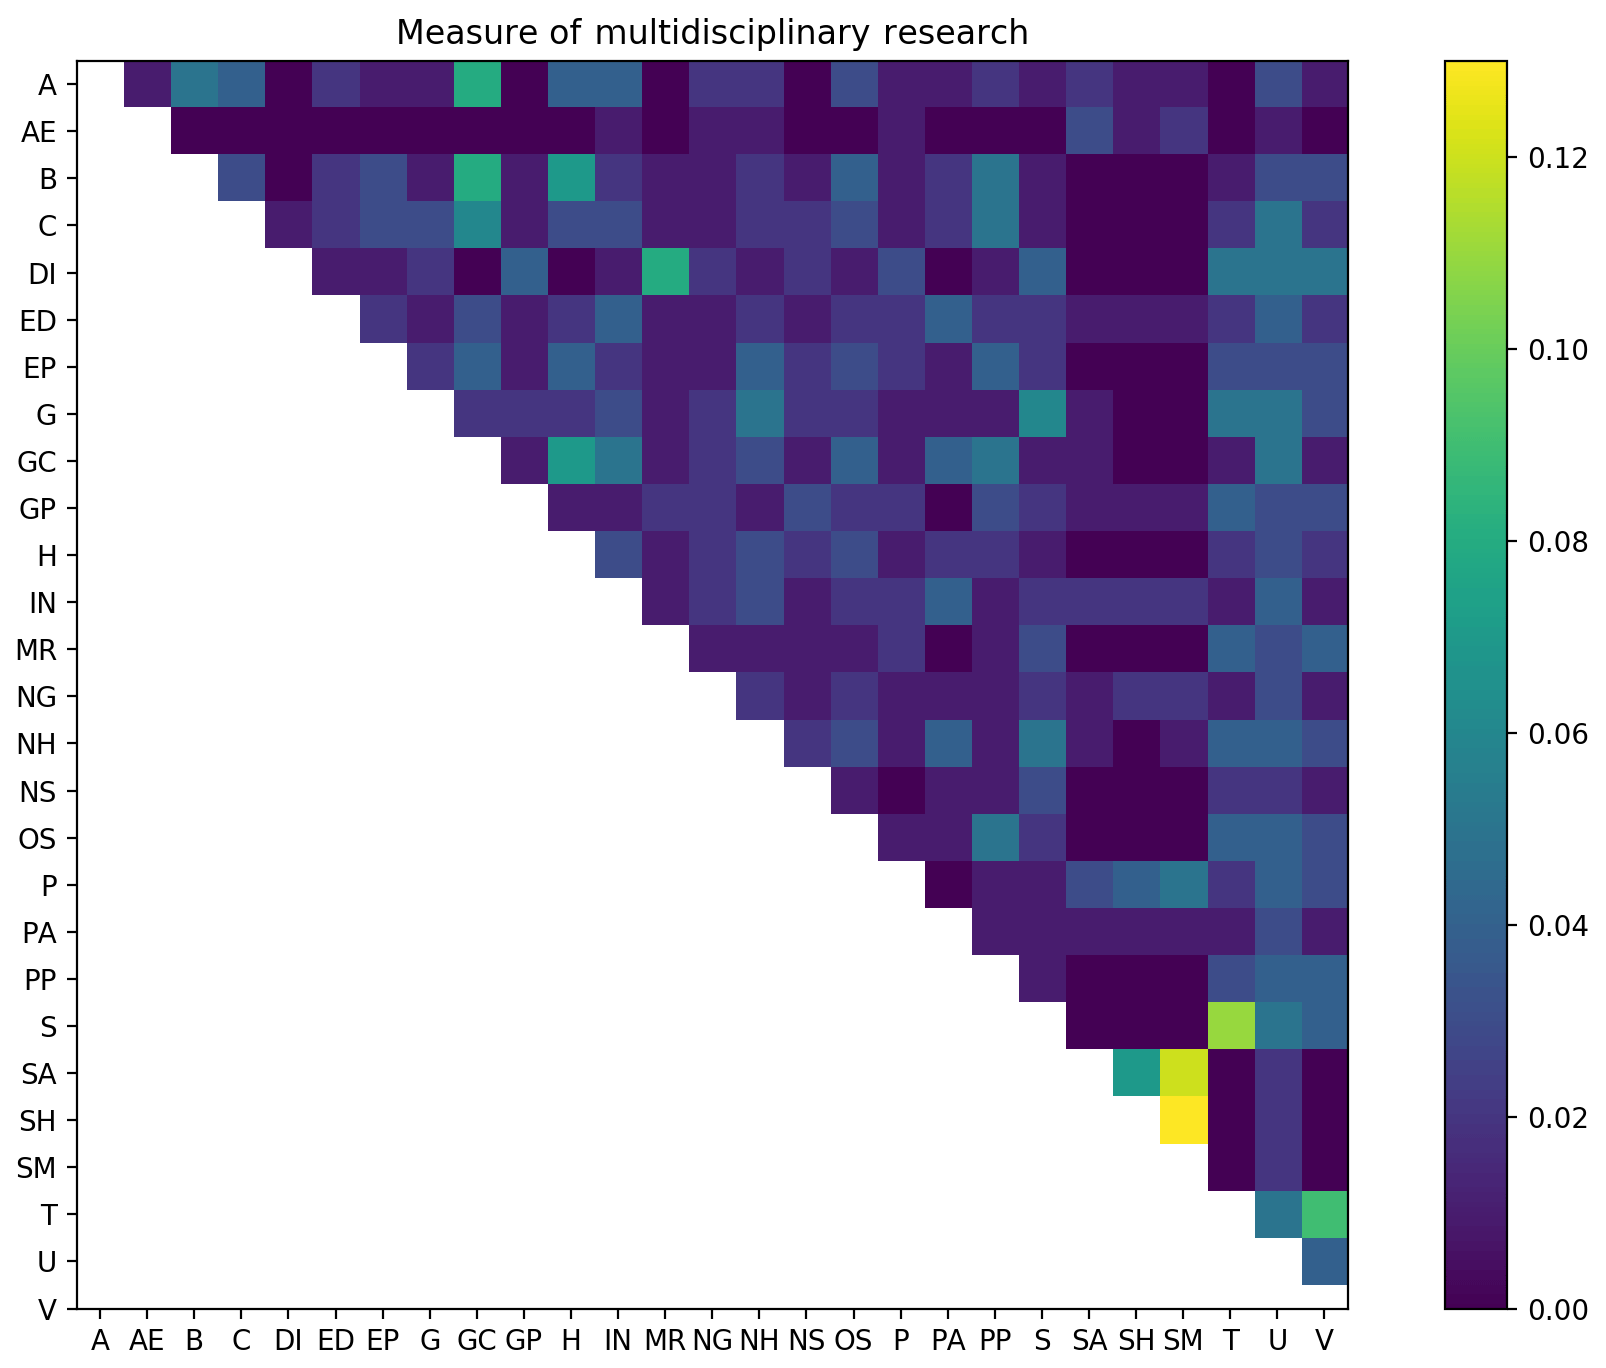
Figure 4Normalized number of occurrences of authors presenting in more than one section over the years 2000–2017. The fractional values in each pair-wise comparison are the number of authors presenting in those sections over the time period 2000–2017 divided by the size of both sections.
Aside from the related space physics sections of SH and SM, we do not see a significant amount of presentations across sections. Authors tend to stay within their primary domains.
3.4 Keyword usage across sections
Authors submitting to the Fall Meeting are asked to tag their abstracts with keywords from the AGU's keyword hierarchy (https://publications.agu.org/author-resource-center/index-terms/, last access: 6 September 2018). We computed counts of each keyword category for each year of our dataset across all sections. For instance, Post-secondary Education and Teaching Methods are sub-topics within the higher-level Education section of the keyword hierarchy. If the Hydrology section had an abstract tagged with Post-secondary Education in 2005 and an abstract tagged with Teaching Methods in 2005, then this would be counted as two Education abstracts for the year 2005. We note that abstracts are not exclusive to one keyword group. Authors are free to self-tag their abstracts with multiple keywords that may span multiple parts of the keyword hierarchy. This is reflected in our analysis where the same abstract may contribute to keyword usage counts in multiple parts of the keyword hierarchy.
For clarity of display, we filtered out keyword groups that did not reach 100 occurrences during the 17 years in which we had data. Figures 5 through 8 highlight specific trends in keyword usage that were observed in our data. The full set of images showing keyword usage from all keyword categories is included in the Supplement.

3.4.1 Scenario 1 – two (or more) seemingly unrelated groups use the same topics
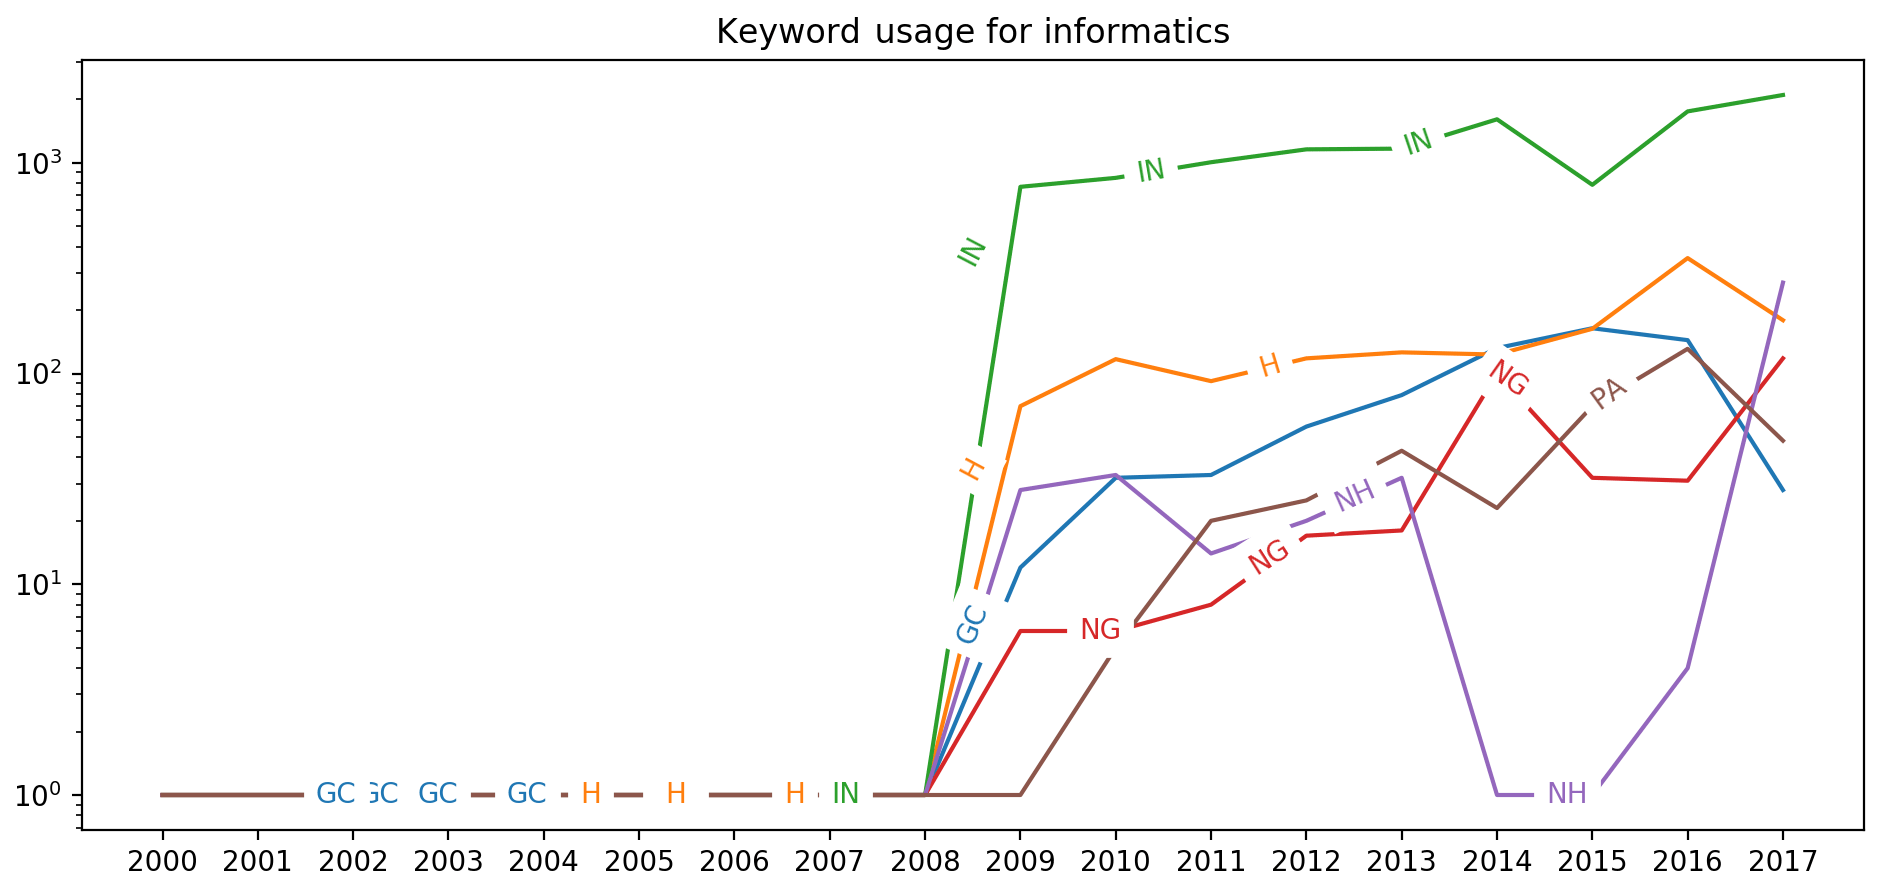
The Earth and Space Science Informatics (IN) section self-describes (https://essi.agu.org/, last access: 6 September 2018) itself as being “concerned with evolving issues of data management and analysis, technologies and methodologies, large-scale computational experimentation and modeling, and hardware and software infrastructure needs”. These concerns span many areas of geoscience and one might expect IN-related keywords to appear in several computationally intensive domains. This does in fact occur, as evidenced in Fig. 5. However, we also see a sharp rise in the Natural Hazards section's usage of IN keywords from 2016 to 2017.
Prior to 2016, the Natural Hazard section never had a year in which they received more than 33 abstracts tagged with IN keywords (see 2010 through 2013 in Fig. 5). Suddenly, in 2017 they received 270 abstracts tagged with IN keywords. This is up from four such abstracts in 2016. The bulk of these 270 abstracts in 2017 can be attributed to the Data Assimilation, Integration, and Fusion and Forcasting topics. These two keyword categories accounted for 87 % of the Natural Hazard IN-related abstracts in 2017. In this particular case, it appears to be specific sessions soliciting topics as opposed to organic emergence of collaborations. The vast majority of these submissions are to one session, NH23E.
To us, this is indicative of the power of simple scientometric visualizations. By simply counting keywords we can begin to identify emerging trends, which, as we discuss further in the next section, can be exploited by meeting and section leadership to better structure future Fall Meetings. Further, more detailed analysis, such as the example above, identifies very effective session planning and emerging science, which can further be exploited by section leadership and the AGU Program Committee.
3.4.2 Scenario 2 – increase in volume
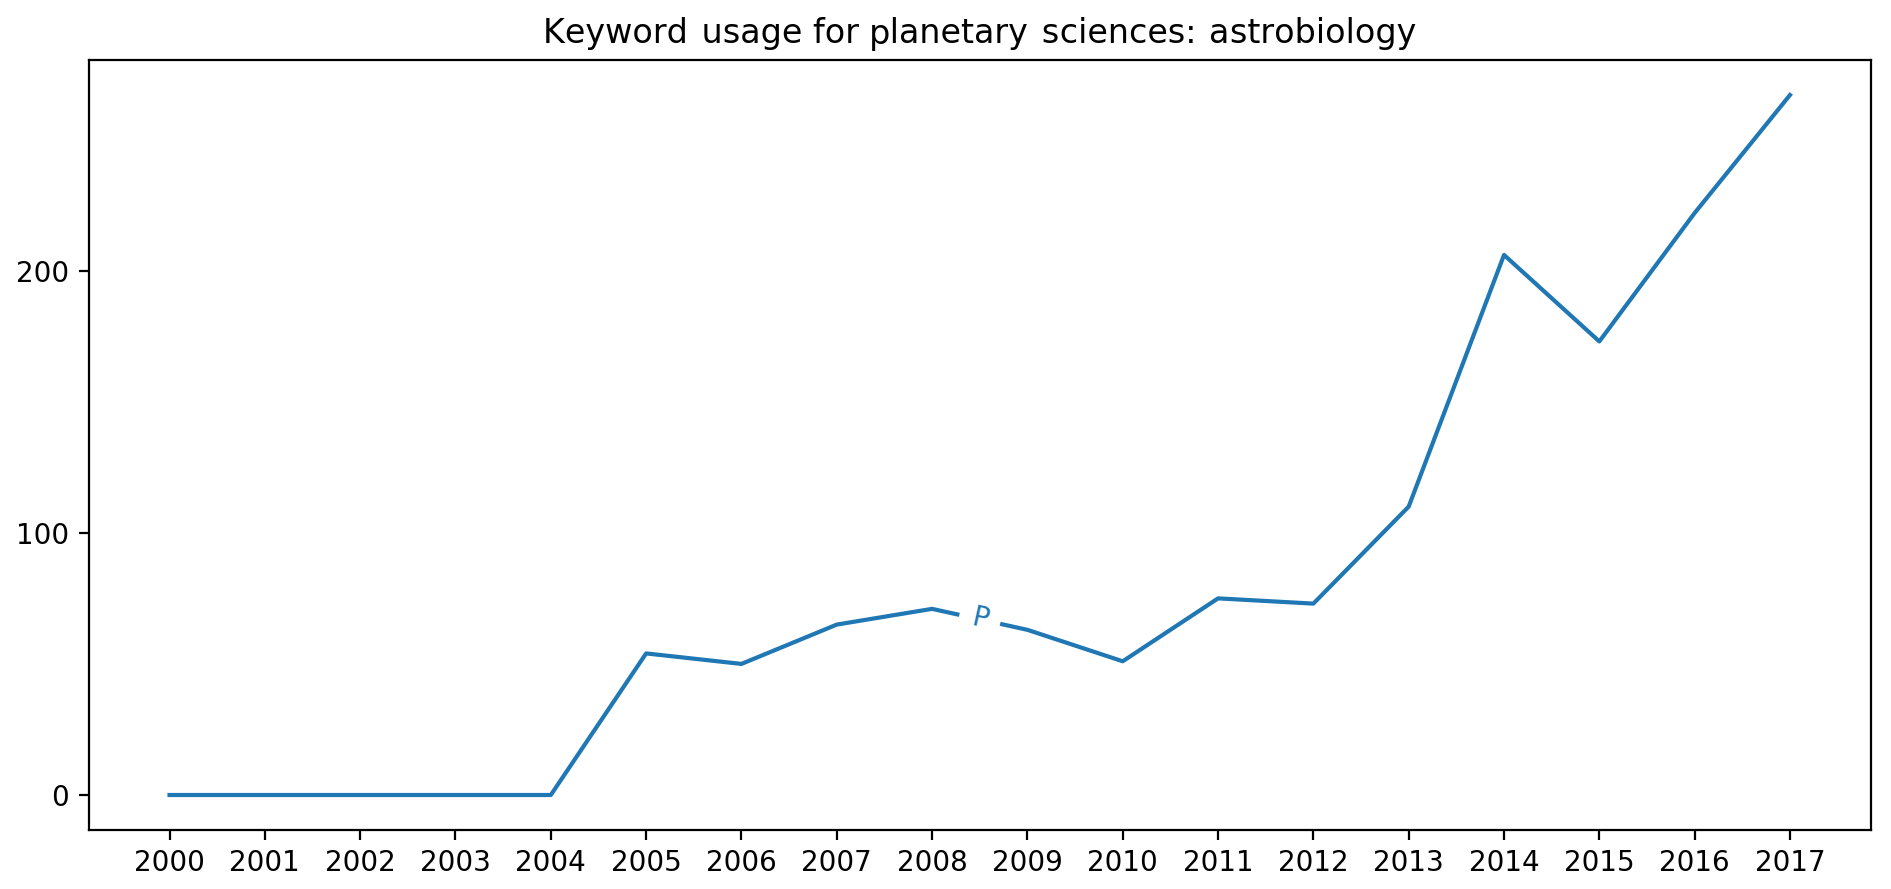
The Planetary Science section is the primary user of Astrobiology keywords as shown in Fig. 6. Usage from 2005 to 2010 was more or less consistent. However, beginning in 2011 a sudden increase in usage is seen that continues to today. A similar trend is seen with Education keywords in Fig. 7. In 2015, Public Affairs and Union sessions saw an increase in abstracts tagged with Education keywords. However, while Public Affairs usage of Education keywords increased gradually, Union's usage of the same keywords had a sudden uptick in 2017.
It may not be surprising that planetary scientists are using astrobiology terms to tag their abstracts. Meeting attendees may even have anecdotal evidence of observing this themselves. However, had someone been tracking these data in 2012 and 2013 we could have seen this trend emerging. This information could have gone into meeting planning and potentially led to more physical space at the meeting venue, joint sessions, increased public outreach, and other initiatives that could have maximized the dissemination of astrobiology science.
The related trend, Fig. 7, shows Union sessions having a sudden uptick in Education-related. A scientometrics- and data-driven AGU could leverage this information in being proactive with joint sessions and when/where presentations are given at the Fall Meeting. We explore this in more detail in the next section.
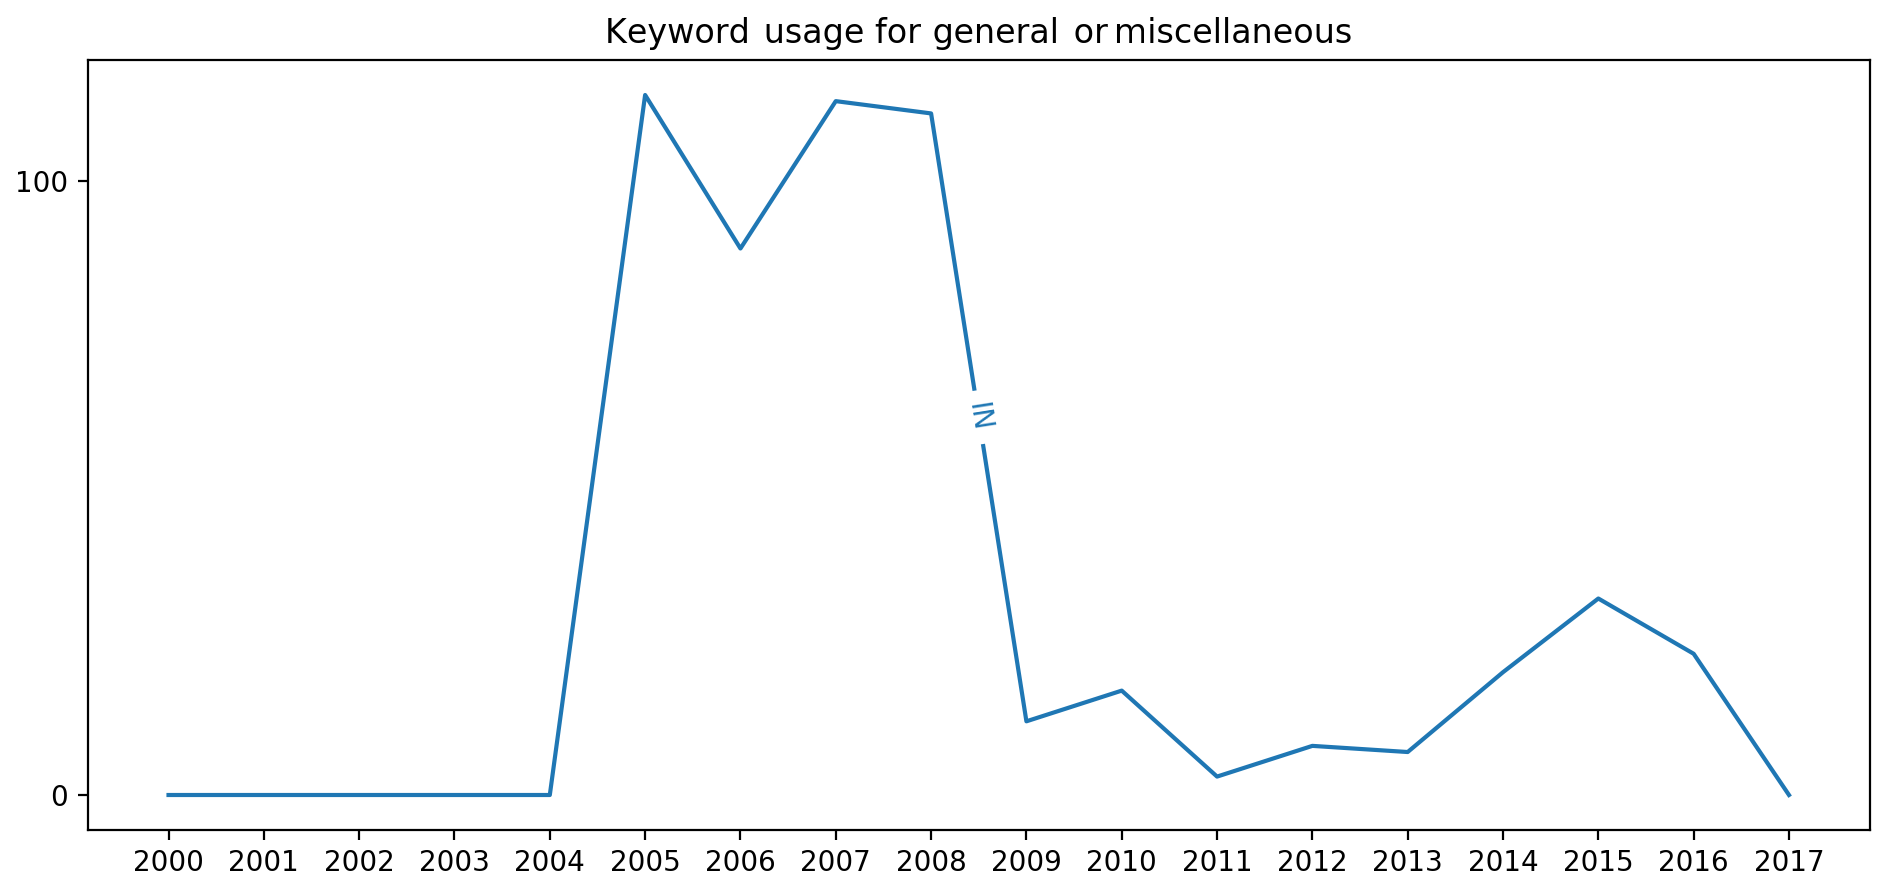
3.4.3 Scenario 3 – keyword usage may indicate new science
The Earth and Space Science Informatics section was formed in 2005. From 2005 until 2008 this section did not have any section-specific keywords in the aforementioned AGU keyword hierarchy. In 2009 IN-specific keywords were introduced. We see this clearly in Fig. 8 where IN's usage of General or Miscellaneous keywords decreased significantly between 2008 and 2011 as IN-specific keywords began to be used. However, we also see a steady increase in General or Miscellaneous from 2011 to 2015. Further analysis of this keyword group reveals steady usage of General or Miscellaneous: Instruments useful in three or more fields and General or Miscellaneous: Techniques applicable in three or more fields during the time period 2011 to 2015. This is suggestive to us that emerging computational approaches and collaborations are not adequately reflected in the AGU keyword hierarchy. This may be more than just the frustration of not finding an appropriate keyword to tag one's abstract. New science may be emerging that could be capitalized on in subsequent Fall Meetings if we are watching the evolution of the AGU network. Further exploration of this particular trend would involve more data than we currently have available and is outside of our current scope.
AGU Fall Meetings are already very busy. Figure 9 shows the number of presentations given each year from 2000 to 2017. We see a steady increase in presentations, with the 2017 Fall Meeting having over 20 000 accepted presentations. Fall Meeting attendees are already hard-pressed to see everything of interest. Using network analysis and having section leaders be proactive prior to a meeting can improve efficiency of science communication and collaboration.

In regard to network density and connected components, there is no optimal network clustering value. However, lower density networks comprised of many loosely connected clusters have been shown to be beneficial (Burt, 2004). In these networks, everyone does not already know each other, and multiple clusters lead to new and unique perspectives. By contrast, when everyone knows everyone else (density = 1), you are more likely to repeatedly hear the same ideas (Burt, 2004).
In order for information to spread across a network, there need to be connections between the clusters. We want to avoid the scenario depicted in Fig. 3 and have at least one connection between each connected component in an AGU section. Knowing how many connected components there are, what the primary research topic of each is (most used keyword), and whom the components are comprised of can be beneficial for meeting planners and section leadership. For the AGU Fall Meeting, session proposal is open to any self-organized group of up to four AGU members. Authors then opt to have their submission assigned to a particular session. We could make this process more proactive by providing section leadership with connected component data and encouraging connections between specific AGU members. This could range from informal networking events to suggesting session co-conveners.
4.1 Steps towards optimizing meeting space
One potential means of enhancing the AGU Fall Meeting is to optimize the physical layout of the event. Historically, oral presentations are arranged by section, with a section having all of its talks grouped in the same part of the building. The poster hall is organized alphabetically by section. What if we leveraged what we are seeing in Figs. 5 and 7 to physically place related sections next to each other? For example, the Fall Meeting could place Natural Hazards posters next to Informatics posters to stimulate more discussion. Similarly, Public Affairs and Union sessions could be physically located near Education sessions and, having identified the trend in Fig. 7, attendees could be encouraged to visit related presentations they may not otherwise be aware of. The AGU has been exploring a related idea via their Scientific Neighborhoods (https://fallmeeting.agu.org/2018/scientific-neighborhoods/, last access: 21 January 2019), although, to the best of our knowledge, Scientific Neighborhoods are not based on any network analysis.
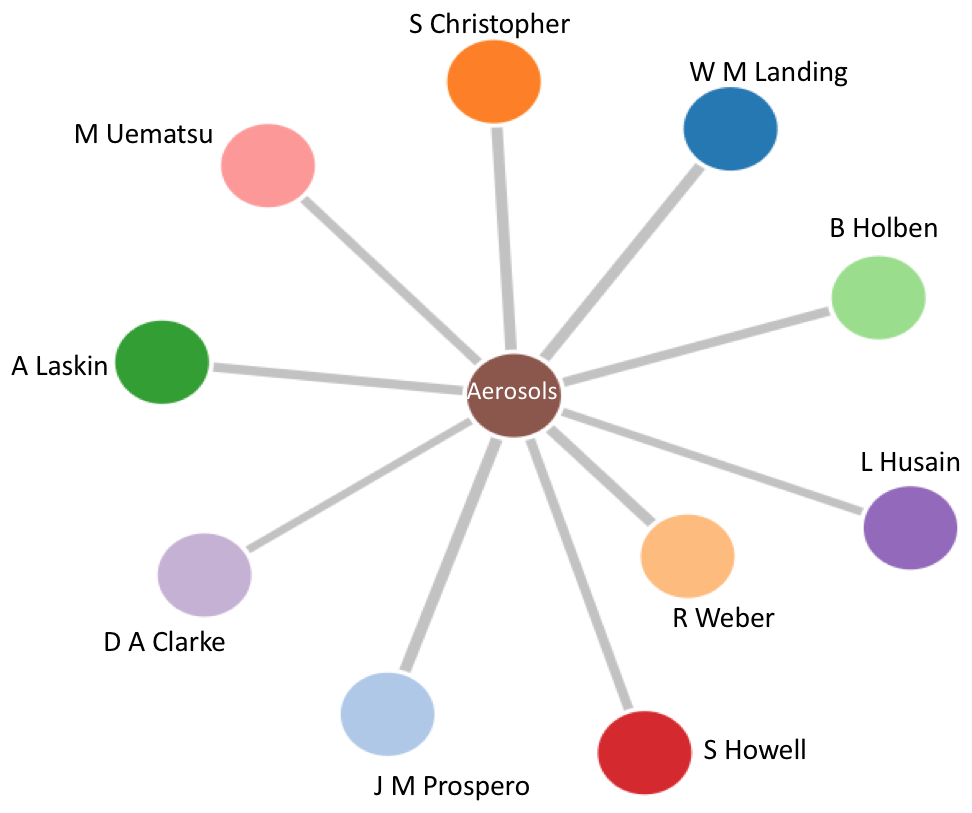
Another option is to facilitate navigation of the meeting via analytics tools built on top of the AGU's historic meeting data. A simple example is shown in Fig. 10. This so-called force-directed graph adds additional information to a standard network graph. In a force-directed graph the distance between two nodes is indicative of the strength of the connection. For instance, in Fig. 10 we show the 10 AGU members who most used the oceanographic Aerosols keyword. R. Weber used this keyword the most over the 17-year period 2000 to 2017. This is indicated in the figure where the R. Weber node is closest to the central Aerosols node.
We want to be clear that we are not advocating for any sort of new metric. We do not need to rank researchers nor do we need to rank the value of their work based on where it is presented. The journal impact factor does a poor enough job of this already (Shanahan, 2016). Rather, we are advocating for tools that would help attendees, especially early-career and new attendees, identify whom they might want to seek out based on their research interests. Figures 11 through 13 show an example tool we built for the AGU Open API Challenge (https://developer.agu.org/projects/, http://apiprojects.agu.org/project1/, last access: 6 September 2018). After identifying a researcher, possibly through a visualization like Fig. 10, the user is guided through finding that researcher in the historical abstract database (Figs. 11 and 12). The co-authorship network is then leveraged to identify all AGU presenters who have co-authored a presentation with the researcher of interest. Figure 13 shows an example for our colleague Peter Wiebe. For brevity, only the 2018 co-authors are shown in the figure. The Abstract column in Fig. 13 lists the year of presentation, the section of the presentation, and the presentation ID. Each row in the Abstract column is a clickable link that will take the user to a web page displaying the presentation title, keywords, and abstract. In this manner, AGU attendees can follow the network to explore existing connections amongst nodes and topics. At present, Fall Meeting data will not be available in the Abstract Browser until after the Fall Meeting concludes. Making these data available prior to the meeting could lead to new tools and apps. The AGU does appear headed in this direction with its recent Open API Challenge.

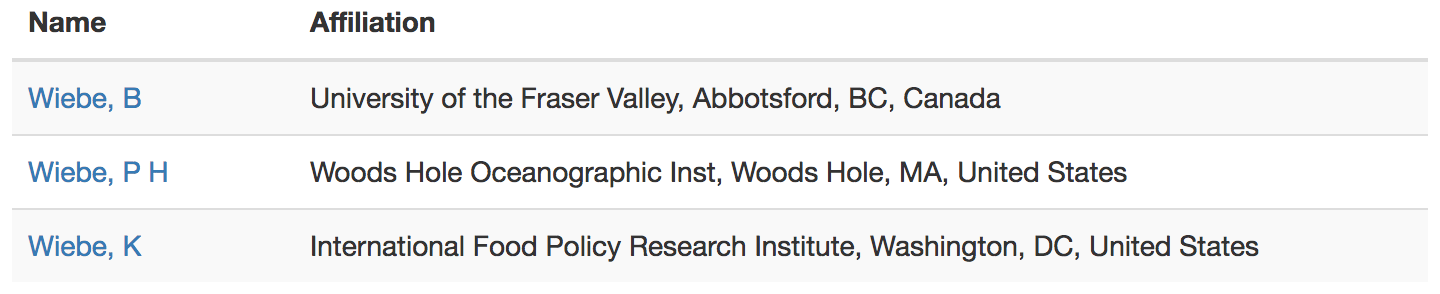
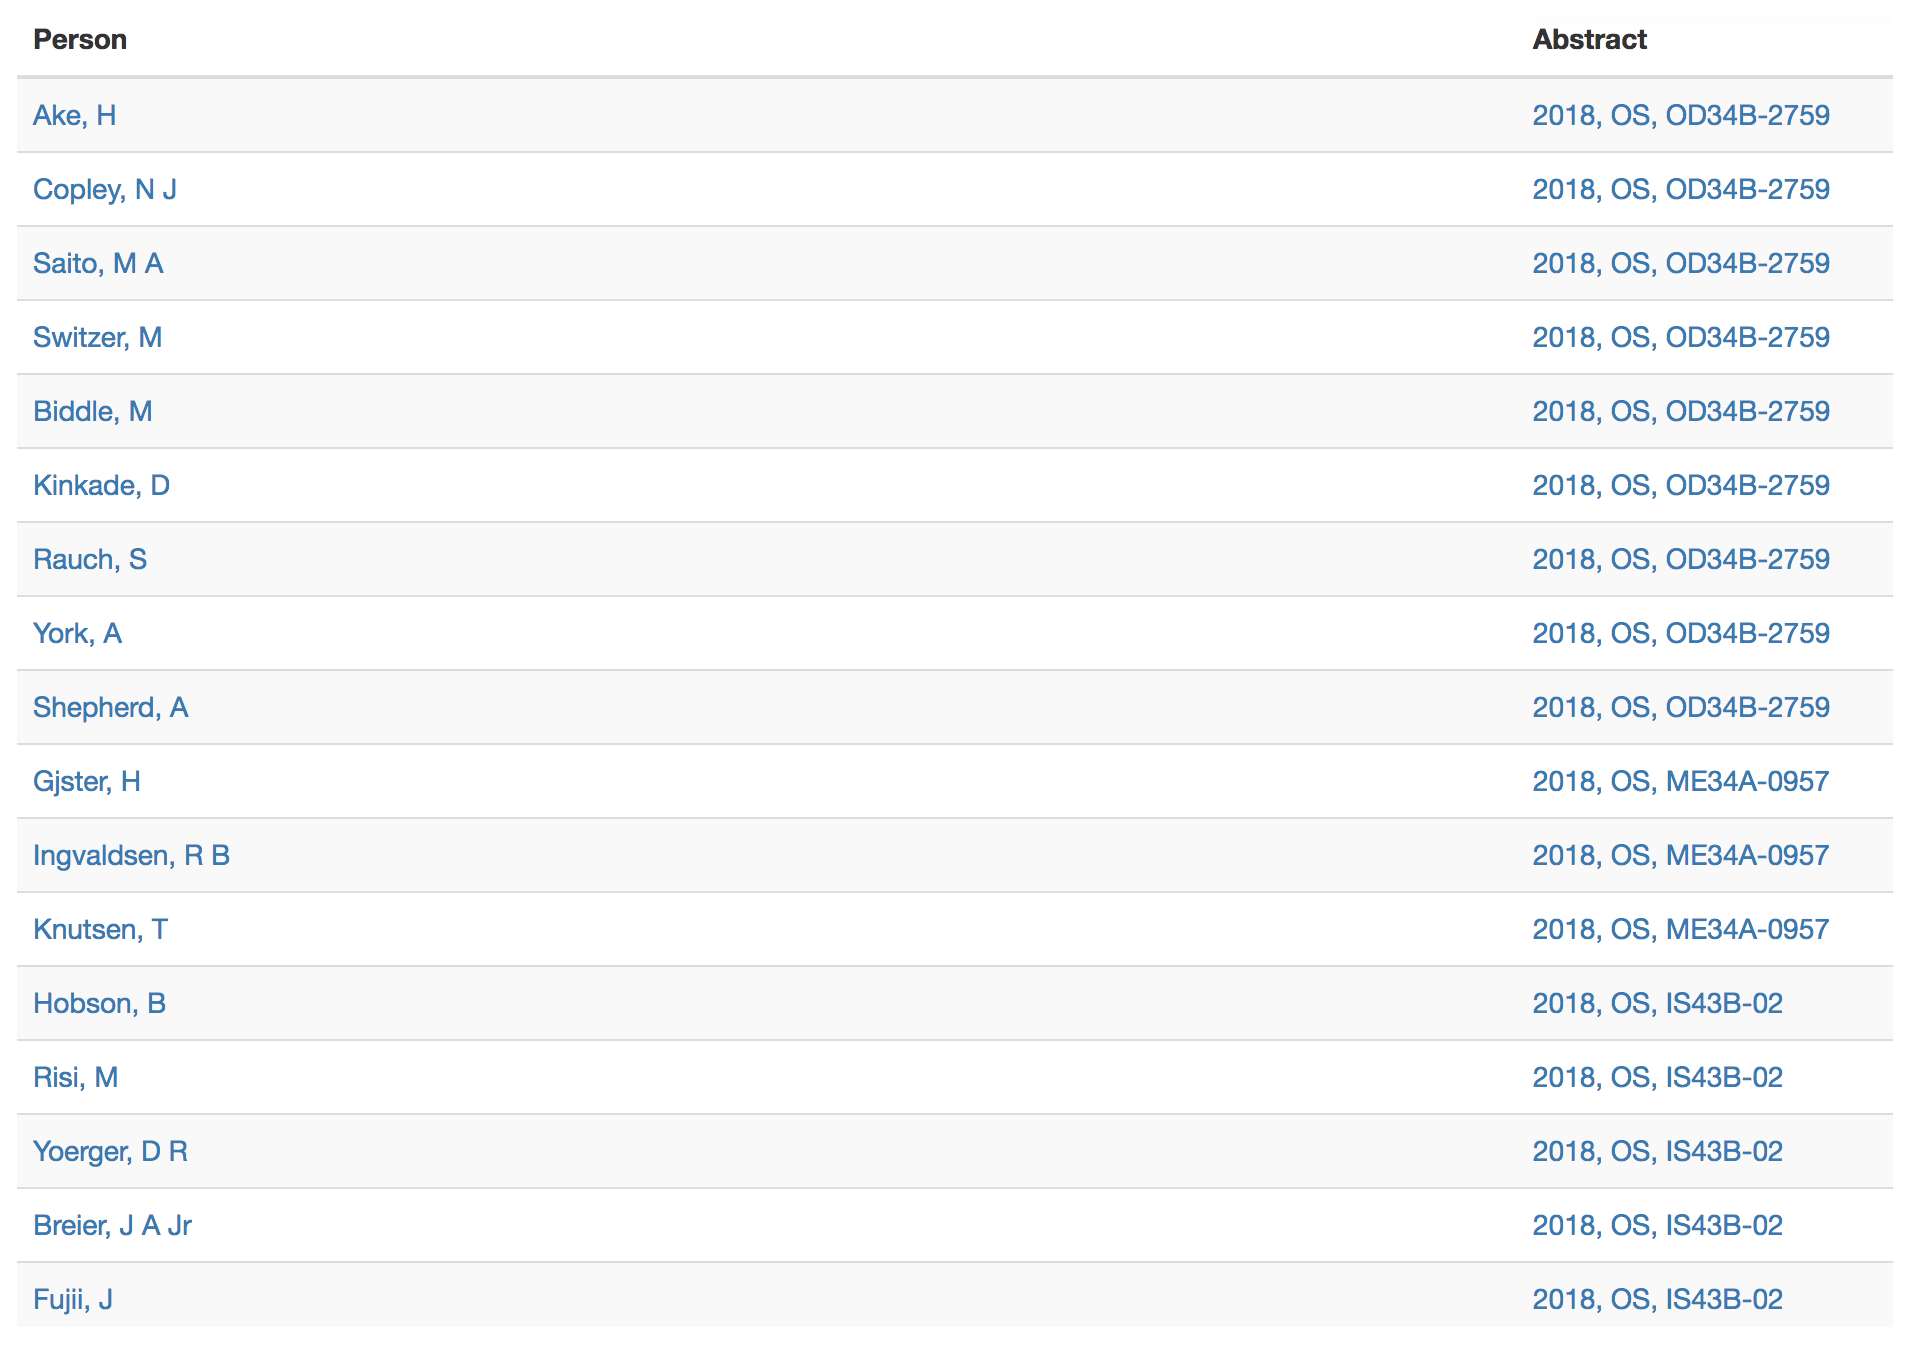
Figure 13The result of our author search tool is a web table with links to everyone who has ever co-authored a presentation with the author of interest. Users can explore the abstracts and network connections of those co-authors – and their co-authors.
4.2 Steps toward gender equality
Ford and colleagues (Ford et al., 2018) have identified a gender imbalance in AGU presentations. Women are invited and assigned oral presentations less often than men. It was found that male primary conveners allocate invited abstracts and oral presentations to women less often and below the proportion of women authors. This trend was apparent regardless of the male primary conveners being students or at more senior career stages. Ford et al. (2018) also identified that women elect for poster-only presentations more so than men.
The dataset used in this study has a longer time span than the one used by Ford et al. (2018). However, our dataset does not include gender or career stage information. We cannot add any new information on the gender imbalance discussion. Scientometrics and network analysis may provide tools to counter this imbalance. However, we are cognizant that more open data may exacerbate the problem by exposing presenters to more opportunities for bias. We highlight these issues here as it is a discussion very much worth having. However, at this time, we are unable to offer any additional data, insights, or strategies.
4.3 Steps toward connections to other networks
GeoLink (Narock et al., 2014; Krisnadhi et al., 2015; Cheatham et al., 2018) is a collection of Linked Open Data that addresses scholarly discovery and collaboration in the geosciences. GeoLink leverages the Semantic Web to publish open data regarding data centers, digital repositories, libraries, and professional societies. One component of the GeoLink knowledge graph (Cheatham et al., 2018) is a collection of all National Science Foundation (NSF) funded projects. Figure 14 (reproduced from Narock and Wimmer, 2017) illustrates what can be done when one network is connected to another. This figure is produced by subsetting the GeoLink NSF-funded projects by people who have presented at the AGU. In particular, we are looking at Semantic Web and semantic integration – a keyword in the Informatics portion of the AGU keyword hierarchy. Combining these two open datasets allowed us to identify which AGU authors had active funded grants at the time of their AGU presentation. We define “active funded grant” as the AGU presentation date falling between the NSF grant's start and end dates. We then looked at the distribution of funding sources. Figure 14 shows the NSF divisions and offices that have funded an AGU author's semantic project. This is only one example and specific to one topic area. However, it illustrates the potential of open science and cross-organizational network analysis. We can begin to see how this research topic is funded by the NSF. In addition, we can start to see the scientific results (AGU presentations) attributable to each NSF division. In this regard, AGU scientometrics can go beyond optimizing Fall Meetings to more general enhancements of open science and science communication. Exponential growth is being observed with the amount of available Linked Open Data roughly doubling each year. Corporations (e.g., the BBC and BestBuy), governments (e.g., the US and UK governments), Wikipedia, social networking sites (e.g., Flickr, Facebook and Twitter), and various academic communities are all contributing to the movement (Hogan et al., 2011). We encourage the AGU to do the same.
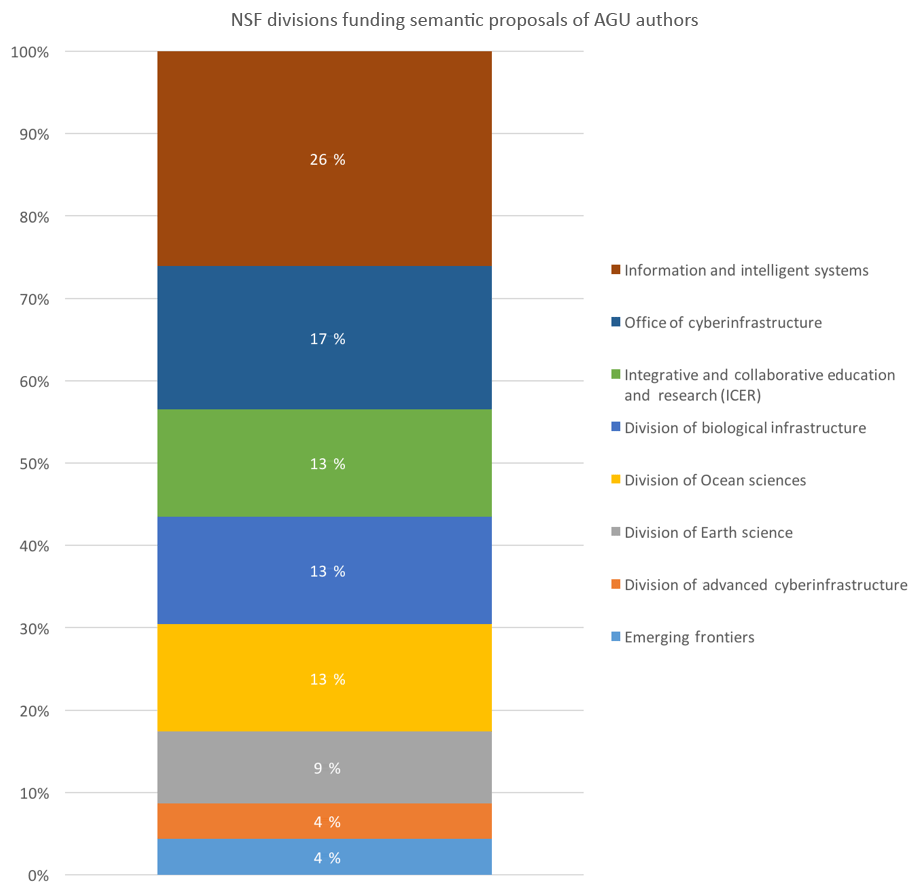
Figure 14An example of combining network data. Here, AGU and NSF networks are merged to identify where AGU presenters are receiving their funding.
The AGU is on the cusp of an incredible milestone. Founded in 1919, the AGU will celebrate its centennial in 2019. There is a lot we can learn from the past 100 years. Network analysis, scientometrics, and data science can help us quantify what we are doing right and identify paths toward improvement. Let us leverage open data and open science to improve how we present our science over the next 100 years. We conclude with a summary of recommendations.
Further explore the percentage change in network density. The AGU is highly invested in collaboration, as evidenced by Science Neighborhoods, Town Halls, and related events. If edges are being added at a rate far below the rate of new nodes, are these collaboration events truly effective?
Explore connected components to identify clusters of research topics and who comprises each cluster. Combination with other datasets to identify career status (e.g., student, early career, senior researcher) can be helpful for the Program Committee in balancing session chairs. Connected component analysis may also be helpful in recommending collaboration amongst components.
The AGU covers a wide cross section of the geosciences. However, the number of researchers presenting across sections appears minimal. The analysis of keywords reveals there are numerous sections interested in the same topics. The AGU should take steps to enhance presentations across sections.
Scientometric analysis can reveal emerging trends and hidden patterns. We advocate for the release of program data prior to the Fall Meeting and the development of open tools that leverage these data. Narock (2018) presented techniques that can help operationalize this into predictive analytics.
Unique identifiers, such as ORCID and the Global Research Identifier Database, can be used to clearly identify researchers and organizations.
Technology and open data may help in efforts to battle gender and minority biases in science presentations. However, more data and easier access to a researcher's history may lead to unintended consequences and additional biases. Our community needs to continue having discussions in this area and actively evaluate the role scientometrics might play.
There is currently a strong push for scientific data to adhere to the FAIR principles (Wilkinson et al., 2016). We believe our science communication efforts should adhere to these principles as well.
The software used in this paper is available from https://doi.org/10.5281/zenodo.2536282 (Narock and Hasnain, 2019) and the data are available via https://doi.org/10.6084/m9.figshare.6625673.v1 (Narock et al., 2018). See the Reference section for complete citations.
The supplement related to this article is available online at: https://doi.org/10.5194/gc-2-55-2019-supplement.
TN was responsible for data acquisition and most of the analysis software used in this project. He also contributed as the lead writer of the manuscript. Authors SH and RS assisted with data analysis by contributing portions of analysis software and assisting in the interpretation of the data.
The authors declare that they have no conflict of interest.
This research was conducted while Sarah Hasnain and Ronie Stephan were students at Notre Dame of Maryland University. We are grateful for National Science Foundation award no. 1704896, EarthCube Building Blocks: Collaborative Proposal: GeoLink - Leveraging Semantics and Linked Data for Data Sharing and Discovery in the Geosciences, which supported them as undergraduate and graduate researchers, respectively.
The first author would also like to acknowledge the contributions of Eric
Rozell and the Earth Science Information Partners (ESIP). Eric helped create
the Linked Data version of the AGU Abstract Database used in this study while
he was a student at Rensselaer Polytechnic Institute, Troy, NY. Eric's work
was made possible through an ESIP mini-grant. The work ESIP enabled, and
Eric's early discussions with the first author, helped lay the groundwork for
the research presented here.
Edited by: Hazel
Gibson
Reviewed by: Evan Goldstein, Mark Parsons, and Laura
Kate Corlew
Berners-Lee, T.: Linked Data – Design Issues, available at: http://www.w3.org/DesignIssues/LinkedData.html (last access: 20 May 2018), 2006.
Bizer, C., Heath, T., and Berners-Lee, T.: Linked Data – The Story So Far, Int. Jo. Seman. Web Informa. Syst., 5, 1–22, 2009.
Braun, T., Glänzel, W., and Schubert, A.: A Hirsch-type index for journals, Scientometrics, 69, 169–173, 2006.
Burt, R. S.: Structural Holes and Good Ideas, Am. J. Sociol., 110, 349–399, https://doi.org/10.1086/421787, 2004.
Cheatham, M., Krisnadhi, A., Amini, R., Hitzler, P., Janowicz, K., Shepherd, A., Narock, T., Jones, M., and Ji, P.: The GeoLink knowledge graph, Big Earth Data, 2, 131–143, https://doi.org/10.1080/20964471.2018.1469291, 2018.
Ford, H. L., Brick, C., Blaufuss, K., and Dekens, P. S.: “Gender Representation of Speaking Opportunities at the American Geophysical Union Fall Meeting”, EarthArXiv preprint, https://doi.org/10.17605/OSF.IO/6QHVD, 2018.
Haak, L. L., Fenner, M., Paglione, L., Pentz, E., and Ratner, H.: ORCID: a system to uniquely identify researchers, Learned Publishing, 25, 259–264, https://doi.org/10.1087/20120404, 2012.
Hirsch, J. E.: An index to quantify an individual's scientific research output, P. Natl. Acad. Sci. USA, 102, 16569–16572, 2005.
Hitzler, P., Krötzsch, M., and Rudolph, S.: Foundations of Semantic Web Technologies, CRC Press, Chapman and Hall/CRC, ISBN: 9781420090505, 2010.
Hogan, A., Zimmermann, A., Umbrich, J., Polleres, A., and Decker, S.: Scalable and distributed methods for entity matching, consolidation and disambiguation over linked data corpora, Web Semantics: Sci. Serv. Agents World Wide Web, https://doi.org/10.1016/j.websem.2011.11.002, 2011.
Hood, W. and Wilson, C.: The literature of bibliometrics, scientometrics, and informetrics, Scientometrics, 52, 291–314, 2001
Krisnadhi, A., Hu, Y., Janowicz, K., Hitzler, P., Arko, R., Carbotte, S., Chandler, C., Cheatham, M., Fils, D., Finin, T., Ji, P., Jones, M., Karima, N., Mickle, A., Narock, T., O'Brien, M., Raymond, L., Shepherd, A., Schildhauer, M., and Wiebe, P.: The GeoLink Modular Oceanographic Ontology, in: Proceedings of the International Semantic Web Conference 2015, Volume 9367 of the series Lecture Notes in Computer Science, 301–309, 2015.
Narock, T.: Predictive Analytics in Earth Science Communication (Invited), Session IN11E, American Geophysical Union Fall Meeting, Washington DC, December, 2018.
Narock, T. and Hasnain, S.: narock/agu_analytics: First Release of AGU Analytics Code (Version v1.0), Zenodo, https://doi.org/10.5281/zenodo.2536282, 2019.
Narock, T., Krisnadhi, A., Hitzler, P., Cheatham, M., Arko, R., Carbotte, S., Shepherd, A., Chandler, C., Raymond, L., Wiebe, P., and Finin, T.: The OceanLink Project, International Workshop on Challenges and Issues on Scholarly Big Data Discovery and Collaboration, 2014, IEEE International Conference on Big Data, Washington DC, USA, 27 October 2014.
Narock, T., Hasnain, S., and Stephan, R.: AGU Network Analysis, figshare, Dataset, https://doi.org/10.6084/m9.figshare.6625673.v1, 2018.
Narock, T. W. and Wimmer, H.: Linked data scientometrics in semantic e-Science, Comput. Geosci., 100, 87–93, 2017.
Narock, T. W., Rozell, E. A., and Robinson, E. M.: Facilitating Collaboration Through Linked Open Data, Abstract ED44A-02 presented at 2012 Fall Meeting, AGU, San Francisco, California, 3–7 December 2012.
Rozell, E. A., Narock, T. W., and Robinson, E. M.: Creating a Linked Data Hub in the Geosciences, Abstract IN51C-1696 presented at 2012 Fall Meeting, AGU, San Francisco, California, 3–7 December 2012.
Shanahan, D. R.: Auto-correlation of journal impact factor for consensus research reporting statements: a cohort study, PeerJ, 4, e1887, https://doi.org/10.7717/peerj.1887, 2016.
Wilkinson, M. D., Dumontier, M., Aalbersberg, I. J., Appleton, G., Axton, M., Baak, A., Blomberg, N., Boiten, J. W., da Silva Santos, L. B., Bourne, P. E., Bouwman, J., Brookes, A. J., Clark, T., Crosas, M., Dillo, I., Dumon, O., Edmunds, S., Evelo, C. T., Finkers, R., Gonzalez-Beltran, A., Gray, A. J., Groth, P., Goble, C., Grethe, J. S., Heringa, J., 'tHoen, P. A., Hooft, R., Kuhn, T., Kok, R., Kok, J., Lusher, S. J., Martone, M. E., Mons, A., Packer, A. L., Persson, B., Rocca-Serra, P., Roos, M., van Schaik, R., Sansone, S. A., Schultes, E., Sengstag, T., Slater, T., Strawn, G., Swertz, M. A., Thompson, M., van der Lei, J., van Mulligen, E., Velterop, J., Waagmeester, A., Wittenburg, P., Wolstencroft, K., Zhao, J., and Mons, B.: The FAIR Guiding Principles for scientific data management and stewardship, Sci. Data, 3, 160018, https://doi.org/10.1038/sdata.2016.18, 2016.
Based on data from the AGU's membership page: https://membership.agu.org/ (last access: 6 September 2018).