 Marie Keiding is a researcher in the Geohazard and Earth Observation team at the Geological Survey of Norway. Together with her colleague, John Dehls, who is leading the project, she works to develop and operate the new mapping service called InSAR Norway.
Before we start, let’s briefly describe what is InSAR. First, the Synthetic Aperture Radar (SAR) is a day and night operational imaging system that can be operated from satellite aircraft or ground and has high capabilities of penetrating clouds because it uses microwaves. Its ‘interferometric configuration’, Interferometric SAR or InSAR, uses two or more SAR images to generate maps of surface deformation or digital elevation models. This is made by calculating differences in the phase of the waves returning to the sensor, as a function of the satellite position and time of acquisition.
Measurements of phase variations are possible only in those pixels of the image where the signal maintains a sufficient coherence between different acquisitions. For this reason, InSAR techniques are particularly suitable to monitor relatively small deformations, in the order of millimetres to centimetres.
Hi Marie, can you tell what is InSAR Norway?
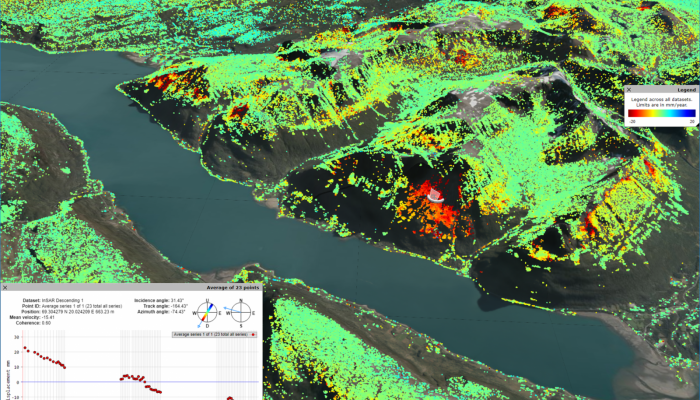
InSAR Norway is the first free and open, nationwide, web-based mapping service for InSAR data. The technology is developed in close collaboration with InSAR specialists at the Norwegian research institute NORCE (formerly Norut). The data comes from the Sentinel-1A and 1B satellites that are part of EU’s Copernicus programme for earth observation.
The mapping service can be viewed in 2D or 3D and it smoothly handles the large dataset. It is possible to download the data in smaller portions, but due to the volume of the data – more than 2 billion data points or 1 TB of data! – it is not possible to download it all at once. The national data set spans the time period 2015-2018 and will be updated at least once a year, more frequently in some areas. Have a look at here if you are interested in more information.
Why did you think to provide such service and why do you think it is important?
At the Geological Survey of Norway, we have used InSAR data for more than a decade to map and monitor unstable rock slopes. Such unstable rock slopes may collapse and cause a rock avalanche, which is an extremely rapid, massive, dry, flow-like motion of fragmented rock (Hungr, Leroueil and Picarelli, 2014).
Norway has experienced a number of rock avalanches with fatal consequences. InSAR is an important tool to detect precursory movements before the collapse to prevent further loss of lives.
In addition, InSAR has been used by consultancy companies to monitor deformation related to constructions work, as well as by the municipalities to detect subsidence due to for example lowering of groundwater level.
With the decision to launch the Sentinel satellites, our group saw the potential to build a national mapping service that could bring out this new, high-quality data to a wide range of users (Fig. 1). The development is supported by the Norwegian Space Agency and the Norwegian authority with responsibility for mitigation of rock avalanche risk (NVE).
What are the main issues you have to face?
It has been an enormous effort to build a service that is operational on a national basis, and we are proud to have come this far. The largest issue we have faced is the volume of data. More than 4000 images per year are being processed, requiring a large degree of automation. In addition, Norway is a country with steep topography and a long snow season. For the preliminary version of the data, now available at www.insar.ngu.no, we have used data from June to October, to avoid periods with considerable snow cover. This selection of data is not optimal for all areas, so future versions of the data will be better tuned to local conditions.
Furthermore, we will develop the functionality to download the data, so that larger portions of the data can be downloaded and imported directly into the user’s work platforms.
Will this service also have operational use (such as warning in case of anomaly accelerations observed)?
The national map will be updated at least once a year. However, we provide data from specific areas on a weekly basis to the authorities responsible for mitigation of rock avalanche risk, so the data are already used in operational monitoring of the risk of rock avalanches.
References
Hungr, O., Leroueil, S., & Picarelli, L. (2014). The Varnes classification of landslide types, an update. Landslides, 11(2), 167-194.
Hari Shankar
Hello Gabriele Amato,
Thank you very much for creating such a beautiful blog on InSAR Applications for Natural Hazards. I am also working in the same field. I want to ask one thing from you, please help me. I want to show PS point distribution computed from PSInSAR technique, on 3D google earth. But Google Earth Pro Desktop is not showing 3D data, 3D data is available on Google earth online. 3D google map is also not available in QGIS. Please help me in plotting PS point data witj 3D background I.e 3D google earth data.
Regards
Gabriele
Hi Hari and thank you for writing. I am sorry but I have never used Google 3D as a base map so I am not sure to be very useful for your necessity. Have you considered using a DEM–>hillshade as base layer and plotting Google Earth 2D (or other satellite images) with some transparency on the hillshade?