Water stables isotopes are commonly exploited in various types of archives for their information on past climate evolutions. Ice cores retrieved from polar ice sheets or high-altitude glaciers are probably the most famous type of climate archives. In ice cores, the message about past temperature variations is conserved in the ice, formed from the snow falls whose isotopic composition vary with the temperatures governing the snow crystals formation. However, deciphering the temperature variations from water isotopes is not always straightforward, as the temperature is not the only parameter which can have an imprint on the isotopic composition of the ice, but other variations like changes in origin of the moisture can also play a role. Water isotopic observations are useful tools to understand the water cycle, as the water masses keep in their isotopic composition a signal of the phase changes they have undergone. Many studies use complex atmospheric models representing the water isotopes to refine the analysis of paleoclimatic data. The same models are also used for future climate projections, a domain where large uncertainties are still linked to the prediction of the water cycle and the changes in precipitations. Water isotopes can be useful to benchmark such models and contribute to their improvement.
To better understand the processes affecting the water isotopic composition in the atmosphere, our group at the Alfred Wegener Institut in Germany has been focusing on the first step of the atmospheric water cycle: the evaporation at the oceanic surface. For this purpose, we have been continuously measuring the water vapour isotopic composition since summer 2015 directly above the ocean surface, on-board the german research ice breaker Polarstern (Figure 1).
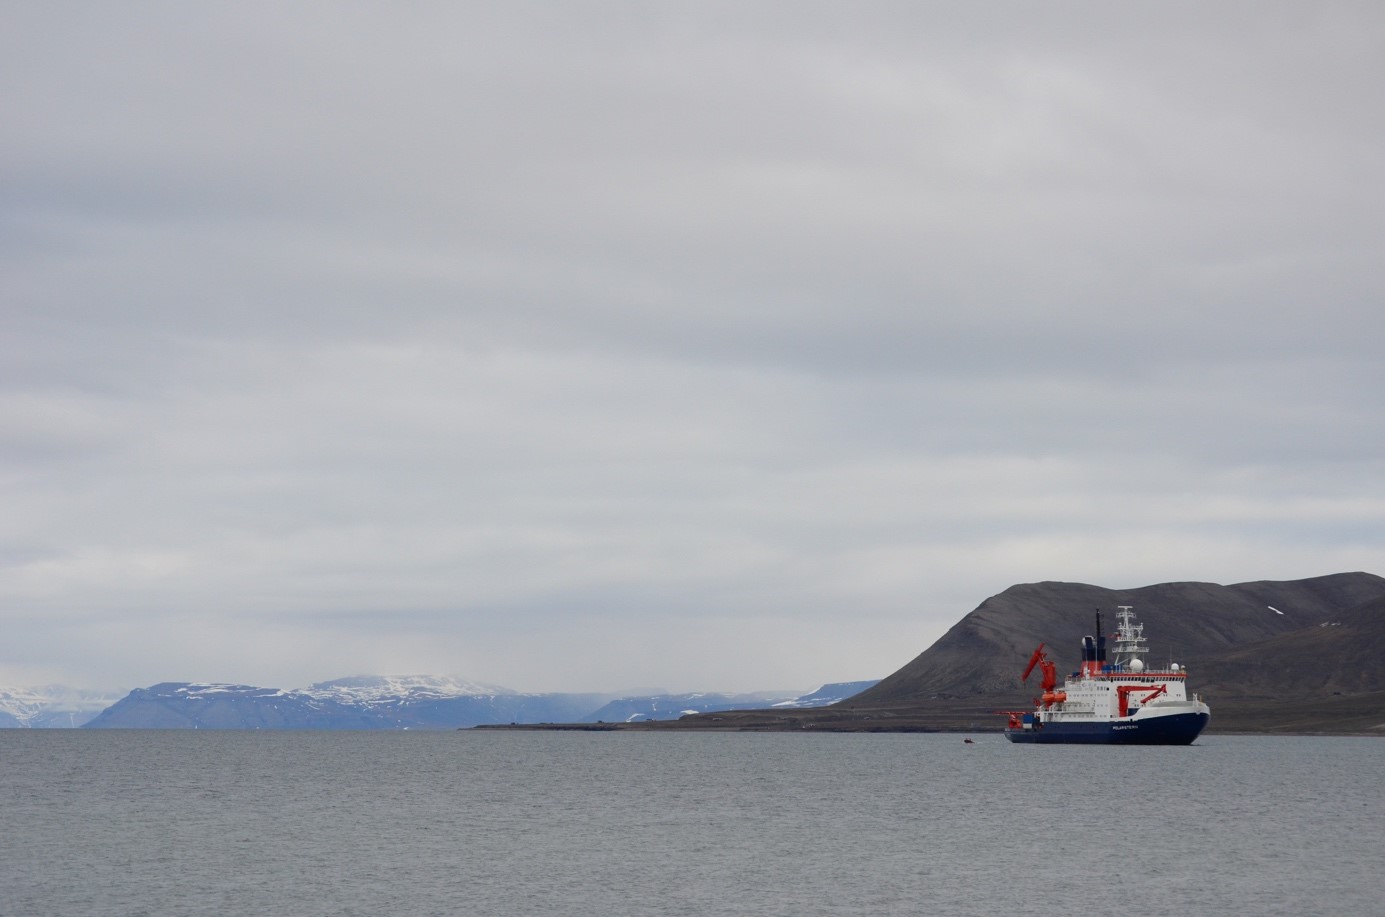
Figure 1: The Polarstern ice breaker in the bay of Longyearbyen, Svalbard, in July 2015.
We measured humidity level, δ18O and δ2H (representing the variations of the amount of water isotopes, H218O and H2H16O, compared to the most abundant isotope H216O) and calculated the second order parameter deuterium excess, defined as d-excess = δ2H – 8.δ18O. Our observations, newly published in Nature Communications, extend over all latitudes in the Atlantic sector, from the North Pole up to the coast of Antarctica (Figure 2), and could therefore also be exploited for many projects involving water isotopes at any latitude around the whole Atlantic basin. They allowed us to experimentally explore the interactions between the atmospheric moisture and the open sea as well as the sea ice.
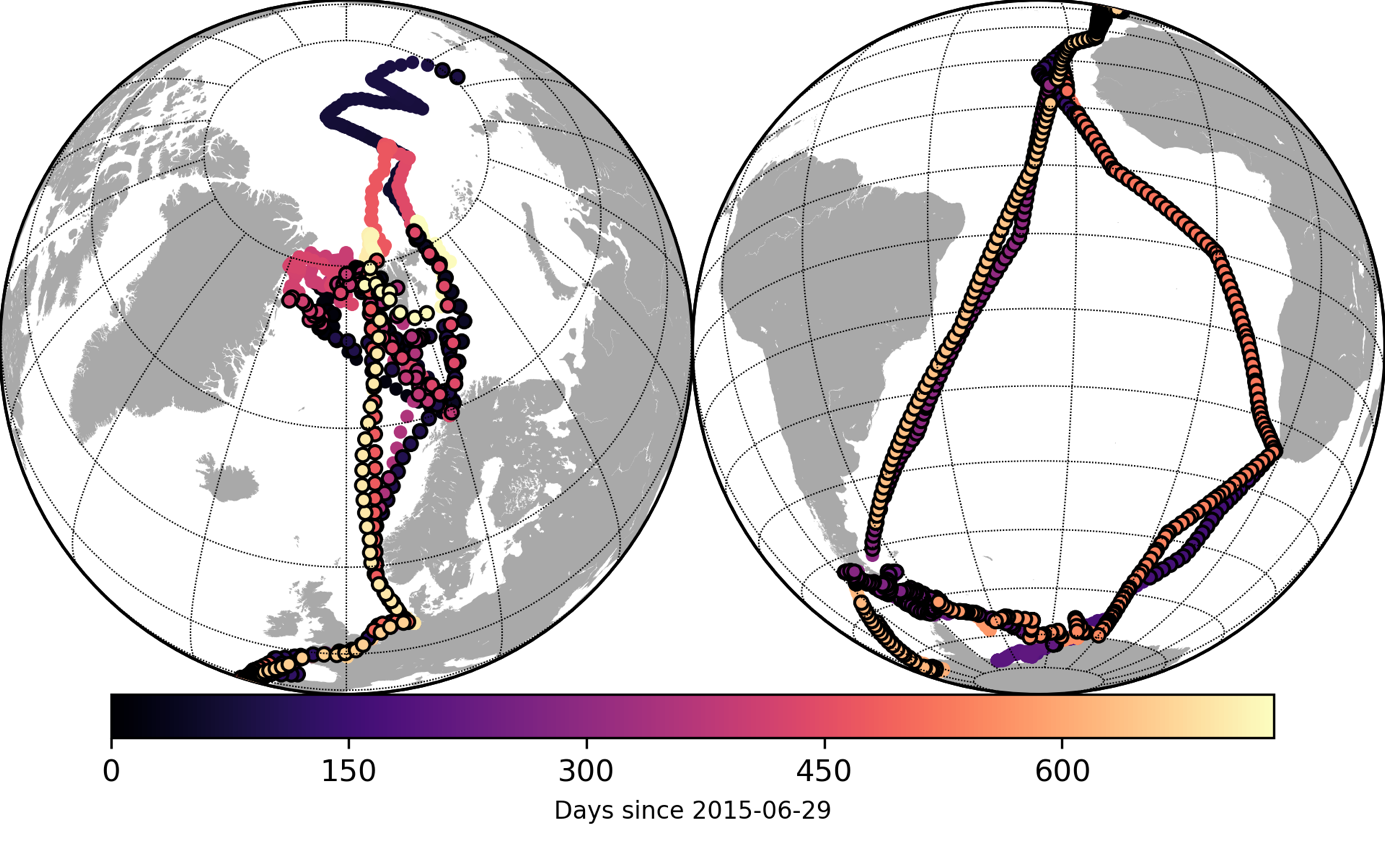
Figure 2: Location of water vapour isotopic observations recorded on board Polarstern, from 2015-06-29 to 2017-07-01
According to a commonly accepted theory proposed about 40 years ago (Merlivat and Jouzel, 1979), the meteorological conditions under which the oceanic evaporation takes place leave their fingerprint in the isotopic composition of the vapour. We have been able to test this theory on the field for the first time under such a large range of climatic conditions. Our observations indeed confirm the expected role of relative humidity and sea surface temperature in the isotopic composition of the evaporated flux. However, contrary to what was expected from this theory, our records reveal that the wind speed at which the evaporation takes place does not leaves its mark in the vapour isotopic composition above the oceans (Figure 3).
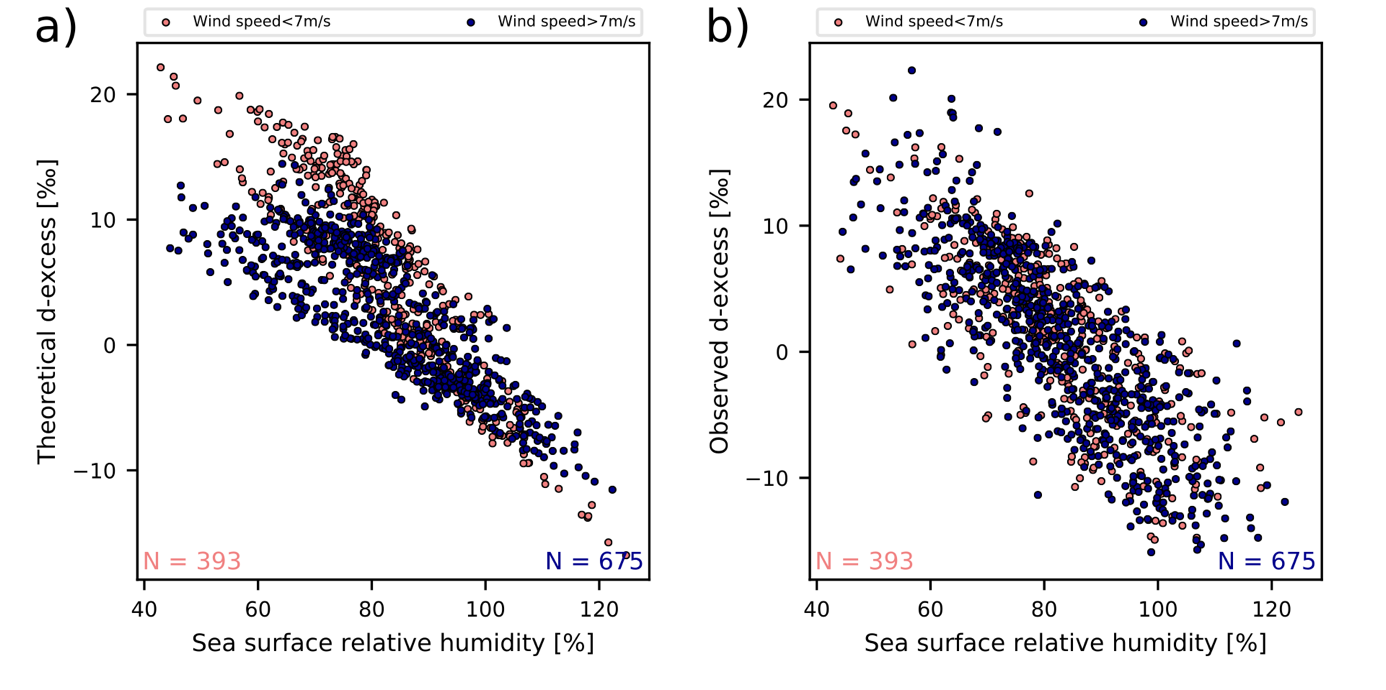
Figure 3: Theoretical effect of wind speed on the vapour isotopic signal d-excess, considering the Merlivat and Jouzel 1979 theory (left panel) compared to observations (right panel). Distinct distributions of d-excess against relative humidity at the sea surface are expected from the theory between low and high wind speeds (below or above 7 m/s, respectively orange and blue), but no difference is observed on the field.
In the sea ice covered areas of the polar oceans, the observations were showing highly different signals than above the open ocean. We have shown that an atmospheric model simulating the isotopic composition of water (ECHAM5-wiso) could at first not reproduce the intensity of these variations. We managed to identify the cause of this discrepancy, by adding a new source of humidity in the model. This model was already considering the sublimation of sea ice as a source of humidity. But so far, it was assuming that the sea ice was formed only from frozen oceanic water and therefore had the same isotopic composition as this oceanic water. However, the surface of the sea ice is also affected by snow falling on top of already formed sea ice. These snow falls having a totally different isotopic composition than the oceanic water, once integrated in the model as a new potential source of sublimation, they drastically changed the simulations of vapour isotopes in polar regions and the model now resolves our observations in these sectors much better (Figure 4).
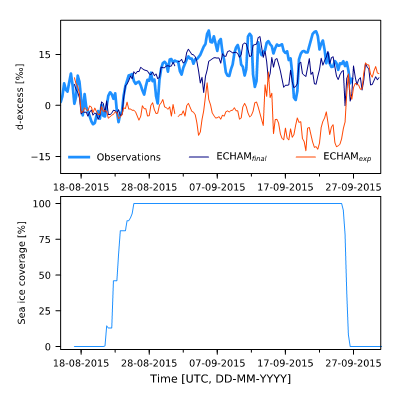
Figure 4: Improvement of the simulated vapour isotopic signal (d-excess) by the isotope-enable atmospheric general circulation model ECHAM5-wiso in sea ice covered areas while considering the deposited snow as a sublimation source (ECHAMfinal, dark blue) compared to bare sea ice created from oceanic water only (ECHAMexp, orange).
Our observations have shown their ability to benchmark atmospheric models of atmospheric water cycle. They highlight different processes having significant consequences on the simulation of water isotopic composition in vapour and precipitation at the global scale which should be considered in all atmospheric water cycle modelling experiments. They contribute to better understanding the creation of the first water isotopic signal during oceanic evaporation. This is particularly important as the oceanic evaporation will later determine the isotopic signal found in subsequent precipitation. The interpretation of past climate archives originally formed from precipitation can therefore be significantly affected by these results.
Edited by Dasaraden Mauree
 Jean-Louis Bonne is an atmospheric scientist at the Alfred Wegener Institut, Bremerhaven in Germany. He prepaed his PhD at the LSCE, Gif-sur-Yvette, France. His research aims at understanding the contributions of local and remote sources to locally observed atmospheric composition by their combination with atmospheric simulations. He has been working on the atmospheric components of the water and carbon cycles, exploiting present-day observations of greenhouse gases and water vapour isotopic compositions. His current project, ISOARC, is focusing on the identification of the moisture sources of the eastern-Arctic. His personal blog can be reached here.
Bernard Bonne
Congratulation for your very interesting post dear J.L. Bonne, you’re doing a pretty nice job….