the Creative Commons Attribution 4.0 License.
the Creative Commons Attribution 4.0 License.
 | 06 Sep 2018
Integrated management of a Swiss cropland is not sufficient to preserve its soil carbon pool in the long term
Annina Winkler
Lukas Hörtnagl
Andrew Revill
Christof Ammann
Petra D'Odorico
Nina Buchmann
Werner Eugster
Croplands are involved in the exchange of carbon dioxide (CO2) between the atmosphere and the biosphere. Furthermore, soil carbon (C) stocks play an important role in soil fertility. It is thus of great interest to know whether intensively managed croplands act as a net source or sink of atmospheric CO2 and if soil C stocks are preserved over long timescales. The FluxNet site CH-Oe2 in Oensingen, Switzerland, has been operational since the end of 2003. This cropland is managed under the Swiss framework of the Proof of Ecological Performance (PEP, a variant of integrated management) with a crop rotation centred on winter wheat, which also includes winter barley, winter rapeseed, peas, potato and intermediate cover crops. In addition to eddy covariance measurements, meteorological and soil measurements were available along with information on C imports and exports from organic fertilisation, sowing and harvesting. This study investigates cropland C budgets over 13 years and assesses whether the PEP regulations resulted in a balanced C budget. The strongest CO2 uptake was observed during cereal seasons. C export through harvest, however, offset the strong uptake of the cereal crops. The largest net CO2 emissions to the atmosphere were observed during pea and cover crop seasons. Net biome production, representing the overall C budget (assuming carbon leaching to groundwater to be negligible), typically ranged between close to C neutral to C losses of up to 407 g C m−2 per season, with peas being the largest source. Overall, the field lost 1674 g C m−2 over 13 years (129 g C m−2 yr−1), which was confirmed by soil C stock measurements at the beginning and the end of the study period. Although managing the field under the regulations of PEP did not result in an overall C sink, model simulations showed that the use of cover crops reduced the C losses compared to leaving the field bare. The use of solid manure improved the C budget by importing substantial amounts of C into the soil, while liquid manure had only a small effect. We thus conclude that additional efforts are needed to bring Swiss management practices closer to the goal of preserving soil C in the long term.


Understanding the net carbon (C) exchange of agricultural fields, which are typically highly managed, is of interest in the context of global warming and rising atmospheric carbon dioxide (CO2) concentrations (Ciais et al., 2013). Through photosynthesis, CO2 is removed from the atmosphere, whilst the respiration of soils and plants releases CO2 to the atmosphere. An ecosystem can be a net CO2 source or sink from an atmospheric point of view, depending on whether photosynthesis or respiration dominates. This exchange of CO2 between an ecosystem and the atmosphere is typically measured with the eddy covariance technique (Baldocchi, 2003; Eugster and Merbold, 2015) as net ecosystem exchange (NEE).
Soil C concentrations have an important influence on soil fertility by improving the soil water-holding capacity, nutrient storage, aggregation, and sorption of organic or inorganic pollutants (Smith et al., 2015). Because agricultural land makes up approximately 37 % of the world's land surface (The World Bank, 2017) and holds substantial amounts of C, soil management can be a powerful means of mitigating C losses of croplands (Lal et al., 2011). Therefore, it is of great interest to determine whether agricultural ecosystems are a C source over longer timescales and how this influences the C stocks in the soil.
To understand whether an ecosystem is losing C, all exports (e.g. harvests) and all imports (e.g. organic fertilisers or seeds) of C need to be considered in order to calculate the net biome production (NBP). There have been a number of studies investigating NEE and the C budget of different ecosystems; however, most of them focused on forests (Adachi et al., 2011; Etzold et al., 2010; Turner et al., 1995; Zielis et al., 2014) and grassland ecosystems (Allard et al., 2007; Ammann et al., 2007; Gilmanov et al., 2007; Li et al., 2008; Soussana et al., 2007). On the other hand, there are relatively few long-term cropland flux stations, resulting in a much lower number of cropland studies. In contrast to forested ecosystems, croplands are often considered overall C sources (Ceschia et al., 2010). Schulze et al. (2009), for example, reported a significant source of 33 Tg C yr−1 for continental European croplands. This may lead to a strong decrease in soil C because large amounts of photosynthetically fixed CO2 are removed from the field during harvest and only a relatively small amount of biomass, in the form of residues and litter, is returned to the soil (Janzen, 2006). The management type and intensity of agricultural ecosystems strongly influences the net C budget (Ceschia et al., 2010; Eugster et al., 2010). Some studies have found that croplands growing specific crops (e.g. maize) and/or under specific management practices (e.g. no tillage or reduced tillage) were net C sinks or C neutral (Hollinger et al., 2005; Nishimura et al., 2008; Robertson et al., 2000).
Most cropland studies looked either at short periods of measurements (single years or only one crop rotation) from single field sites (Anthoni et al., 2004; Aubinet et al., 2009; Béziat et al., 2009; Chi et al., 2016; Moureaux et al., 2006, 2008; Schmidt et al., 2012), combined measurements from different field sites (Ceschia et al., 2010; Eugster et al., 2010; Gilmanov et al., 2013; Janssens et al., 2003; Jensen et al., 2017; Joo et al., 2016; Kutsch et al., 2010) or were based on model simulations (Parazoo et al., 2014; Vuichard et al., 2016). Prescher et al. (2010) pointed out the need for long periods for investigating management influences on the NBP. Furthermore, only with long-term measurements can a direct comparison with soil C stocks be made, because stocks change only slowly and are typically only measured at decadal intervals. There have been only three studies analysing the C budget of croplands in detail at a single site over a longer timescale: Suyker and Verma (2012) and Dold et al. (2017) studied maize–soybean rotations in the United States over 8 and 9 years, respectively, and Buysse et al. (2017) studied a 4-year crop rotation field in Belgium over 12 years.
At the Swiss FluxNet cropland site CH-Oe2 in Oensingen, Switzerland, long-term eddy covariance and meteorological measurements have been conducted since 2003. This is the only long-term Swiss FluxNet cropland site. The field is managed under the Swiss integrated management framework of the Proof of Ecological Performance (PEP) (Swiss Federal Council, 2017). The term “integrated management” is defined here as a more sustainable management approach when compared to conventional agricultural practices and focuses not only on economical benefits but also takes ecological aspects into account. These agricultural regulations were introduced in Switzerland in the late 1980s. The PEP regulations include, amongst other requirements, the fulfilment of neutral nitrogen (N) and phosphorus budgets, the implementation of a crop rotation, an appropriate soil protection (e.g. by planting cover crops in the autumn, to avoid bare fields during winter), and the reduction and more efficient use of fertilisers and pesticides.
Given that there is little known about the detailed long-term C budgets of crop fields, especially in Switzerland, and to understand whether implementing PEP has also led to a balanced C budget, the objectives of this study were to (1) analyse the NBP of the crop field over 13 years, (2) determine the impact of the different crop types on NBP and (3) assess the differences in C loss by planting a cover crop compared to a bare field.
2.1 Measurement site
The CH-Oe2 field site is located in Oensingen, in the canton of Solothurn, Switzerland (47∘17′11.1 N, 7∘44′01.5 E; 452 m a.s.l.). The crop field has an extent of 1.55 ha with a Fluvisol with 42 % clay, 33 % silt and 25 % sand (Alaoui and Goetz, 2008). The average air temperature (TA) at the site is 9.8 ∘C, and the average annual precipitation (Prec) is 1155 mm (Fig. 1, period 2004 to 2016; the diagram was produced in R with the diagwl function of the climatol package). The field has been managed under the regulations of PEP since the late 1990s, featuring a 3-year crop rotation (Table 1). The main crop has been winter wheat, which is usually planted every third year followed by winter barley. The third crop in the rotation was either potato, winter rapeseed or peas. Only between autumn 2006 and autumn 2010 was wheat planted every second year. Before summer crops (potato or peas) were sown, Phacelia only (2009 and 2015) or a mixture of summer oat, Phacelia and Alexandrine clover (2005) was planted. After every rapeseed harvest, a voluntary regrowth of the rapeseed was allowed and the newly grown rapeseed plants were then mulched and incorporated into the soil later in the autumn before wheat was sown. Before the management under PEP started in the late 1990s, the field had an 8-year arable–ley rotation, including 3 years of perennial grass–clover mixture.

Figure 1Climate diagram after Walter and Lieth (1960) for the time period of 2004 to 2016. The monthly average air temperature (TA) and the monthly total precipitation (Prec) are shown in red and blue, respectively. Average (Avg), average minimum (Min) and average maximum (Max) annual TA and average annual total (Sum) precipitation are listed at the top of the figure. Note that the scale of the right axis changes above 100 mm.
Management information including dates and type of tillage, sowing dates and seed weights, fertilisation dates and amounts, dates of pesticide applications, and harvest dates and yield (grain and straw) was regularly provided by the farmer (Table 1). Management timing and field conditions were confirmed with webcam images of the field (since 20 May 2005 taken at 10:30, 12:30 and 14:30 CET (UTC + 1 h) and since 1 March 2015 at 09:30, 12:30 and 14:30 CET). In the case of wheat, barley and rapeseed, the moisture content of the harvested grains was reported by the farmer. Cover crops were not harvested and thus ploughed into the soil. No harvest was conducted for the potatoes in 2006; due to a hail storm on 5 July 2006 the potatoes were of very poor quality and therefore left in the ground and later ploughed under. Between 2004 and 2016, solid manure was applied on three occasions (always at the end of the cover crop seasons), whereas liquid manure was applied on five occasions (at the end of wheat, barley and rapeseed seasons). A crop season is defined here as the period between sowing of a crop and sowing of the following crop. Mineral fertilisers were applied during all crop seasons, except for cover crops and the 2016 pea season. Herbicides were applied during all crop seasons, except for cover crops and the potato season. Fungicides were only used in spring 2004 (wheat), 2005, 2012 and 2015 (all barley), and insecticides were applied during the rapeseed season in 2007–2008 and during the 2010 pea season. Grubbing (shallow secondary tillage) was conducted almost every year, ploughing approximately every third year (typical depth of 30 cm), and harrowing was conducted every year since 2010. In 2005, the cover crop was mulched on 9 November. In 2010 and 2016, the cover crop was incorporated into the ground shortly before the next crop was sown without any preceding mulching.
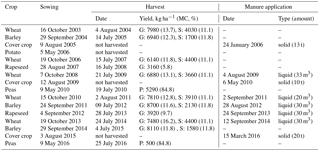
Table 1Management information for all 16 crop seasons (defined as sowing of the current crop to sowing of the following crop) between 2003 and 2016 with crop type, sowing and harvest dates, and yield (G: grain, P: peas, S: straw). Moisture content of the harvested biomass (MC) is given in parentheses. If manure was applied during the crop season, the date, manure type and amount are given as well.
2.2 Turbulent fluxes
Since the end of December 2003, eddy covariance (EC) measurements have been made at the site. The eddy covariance measurements consist of three-dimensional wind speed and air temperature measurements with an ultrasonic anemometer (R3-50; Gill Instruments Ltd., Lymington, hampshire, UK) as well as CO2 and water vapour measurements with an open-path infrared gas analyser (LI-7500; LI-COR, Lincoln, NB, USA) and were recorded at 20 Hz.
The eddy covariance data were processed and quality controlled with the software EddyPro (version 6.2.0, LI-COR). Thereby, 30 min averaged fluxes were calculated and the following corrections and filters were applied: high-frequency despiking and a drop-out test (on the raw data) following Vickers and Mahrt (1997), angle-of-attack correction (Nakai et al., 2006), double rotation (Wilczak et al., 2001), lag time compensation via covariance maximisation using a default lag time if a maximum was not attained within a plausible window, density fluctuation correction (Webb et al., 1980), high-pass filter (Horst, 1997), low-pass filter (Moncrieff et al., 2004), and a steady-state test and test for well-developed turbulence conditions (on the processed fluxes). Fluxes were rejected from further analyses when they were outside a physically plausible range (±50 µmol m−2 s−1). From November 2015 to May 2016, an angle-of-attack filter was also applied, which discarded half-hourly fluxes if the angle of attack was outside the range of −10 to 30∘ for more than 10 % of the half hours. This additional quality criterion was applied to filter out time periods of an occasional malfunctioning of an anemometer transducer. During times of repair of the R3-50 ultrasonic anemometer, the ultrasonic anemometer was replaced by a model HR-100 ultrasonic anemometer (Gill). CO2 storage in the air layer below the flux measurement height was calculated according to Aubinet et al. (2001) within EddyPro.
NEE was calculated by adding the half-hourly CO2 flux and CO2 storage and subsequently despiked by iteratively removing outliers outside the valid range defined as the mean ± 3 times its standard deviation (SD) (Rogiers et al., 2004) based on a 30-day moving window. NEE was then gap filled and partitioned into gross primary production (GPP) and ecosystem respiration (Reco) based on Reichstein et al. (2005) using the R software REddyProc by the MPI Jena (Reichstein et al., 2017). Gap filling was done after applying an automatically determined u* filter (with a threshold ranging between 0.01 and 0.13 m s−1; changed for each crop season). The u* threshold was automatically determined for each bare soil period and growing period separately within REddyProc by determining the saturation of NEE with u*. In total, NEE had to be gap filled for 46 % of the half hours.
For the beginning of the first wheat season (October to December 2003), the measurement station was not established yet and therefore no flux data were available. From November 2006 until February 2007, no reliable NEE measurements were available due to a sonic anemometer malfunctioning. Therefore, NEE was estimated for these two time periods in 2003 and 2006–2007 by averaging the gap-filled NEE of the corresponding days of the wheat seasons in 2008, 2010 and 2013 (on a daily basis).
2.2.1 Yield, seed and manure
Moisture contents of straw and seeds were determined in the lab by weighing a subsample with a high-precision scale before and after drying in the oven at 55 ∘C. Elemental C concentrations of dried and ground yield as well as seed samples were measured with a Flash EA 1112 Series elemental analyser (Thermo Italy, Rhodano, Italy) coupled to a Finnigan MAT DeltaplusXP isotope ratio mass spectrometer (Finnigan MAT, Bremen, Germany) according to Brooks et al. (2003) and Werner et al. (1999), with a sample, blank and laboratory standard positioning (identical treatment principle) following Werner and Brand (2001). The performance was tested with laboratory standards. The C concentrations and moisture contents of manure were measured in 2006 (solid) and 2017 (liquid) at the laboratory LBU (Thun, Switzerland) and in 2009 (liquid) by Agroscope (Zurich, Switzerland). The measurements in 2006 were used for all other solid manure applications (2006, 2010 and 2015) as well. In the case of liquid manure, an average of all available liquid manure measurements of CH-Oe2 and the neighbouring site CH-Oe1 (Ammann et al., 2009) were averaged when the manure was not analysed during a given year. In cases when the moisture content or C concentration of the harvested biomass was not measured, the value was substituted by the average of all other available seasons of the same crop. In the case of peas, a sample from a neighbouring field in 2017 was used to determine the moisture content of the peas at harvest. To determine the C export and import (g C m−2) through harvest, fertilisation and sowing, first the dry weight of the yields, fertilisers and seeds was calculated and then multiplied by the corresponding C concentration.
2.2.2 Soil carbon and nitrogen
Soil C and N concentrations were measured in 2004 and 2017. On 13 October 2004, soil samples were taken to a depth of 12 cm at 36 locations in the field. Each sample was divided into two parts (0–6 and 6–12 cm of depth), from which the C and N concentrations were determined with an elemental analyser (LECO CHN-1000; LECO Corp., St. Joseph, MI, USA) after sieving (1 mm mesh), drying and grinding the soil. Additionally, the bulk density of the soil was determined for a 4 cm deep core within the top 12 cm of the soil at the same 36 locations on the field.
In 2017, soil samples for C and N measurements were taken on five days (23 February, 23 March, 5 April, 4 May and 31 May), of which two days were before and three were after the application of liquid manure (31 March 2017). Sampling dates before and after the application of liquid manure were chosen to see if it would change the soil C and N significantly. At 12 locations, the samples were taken to a depth of 30 cm and at four locations to a depth of 70 cm. These samples were divided into subsamples of 0–15, 15–30, 30–50 and 50–70 cm of depth on the first four sample days and 0–2, 2–5, 5–10, 10–15, 15–30, 30–50 and 50–70 cm on the last sample day. All samples were processed the same way as in 2004. Concentrations of C and N were determined with the same set-up as for yield C concentrations. In 2017, bulk density of the soil was determined at four locations for 5.5–9.5 cm of depth and 20.5–24.5 cm of depth and at one location for 0.5–4.5, 5.5–9.5, 10.5–14.5, 20.5–24.5, 38.0–42.0 and 58.0–62.0 cm of depth. Averages of C and N concentration and bulk density for each depth layer and year were calculated, and soil C and N densities (ρC and ρN, respectively) were then determined by multiplying the average C and N concentration of a depth layer by the corresponding average bulk density. For stock calculations, the ρC or ρN of each depth layer was multiplied by the layer thickness and then all depth layers were summed.
The statistical analysis of differences in soil C and N vertically and over time was conducted in R. The significance of changes in soil bulk density as well as soil C and N concentrations, densities and stocks between 2004 and 2017 was determined with a one-sided t test. To test whether vertical differences in C and N densities in 2017 were significant a one-way ANOVA with a following post hoc test was conducted. To test whether the application of slurry in 2017 resulted in a change in C densities, a two-way ANOVA including interactions of the factors time of sampling and depth with following post hoc tests was conducted.
The uncertainty of the LECO CHN 1000 analyser was determined from repeated measurements of two standards and one blank (standard deviations). At concentrations in the range of soil samples the accuracy of the C and N contents is ±1.7 % and ±3.9 %, respectively. The uncertainty of the C and N contents measured with the elemental analyser in 2017 were ±1.5 % and ±1.7 % of the C and N contents, respectively, determined as the average from seven batches
2.2.3 Ancillary meteorological and soil measurements
Further ancillary meteorological and soil measurements have been made at the site since the end of 2003. The set-up consists of an air temperature and relative humidity sensor (CS215; Campbell Scientific Ltd., Logan UT, USA; 2 m of height), a cup anemometer (A100R; Vector Instruments, Denbighshire, UK; 2 m of height) and a wind vane (W100P; Vector Instruments; 2 m of height), a four-component net radiometer (CNR1; Kipp & Zonen, Delft, the Netherlands; until November 2014 at 1 m of height, afterwards at 2 m of height), a sunshine sensor measuring diffuse and total photosynthetically active radiation (until June 2014 BF3, afterwards BF5; Delta T, Cambridge, UK; until November 2014 at 1 m of height, afterwards at 2 m of height), four heat flux plates (HFP01; Hukseflux B.V., Delft, the Netherlands; 0.03 m of depth) with corresponding soil temperature probes (model 107; Campbell Scientific; 0.015 m of depth), a soil moisture probe profile (ECH2O; Decagon Devices Inc., Pullmann, WA, USA; 0.05, 0.15, 0.30, 0.50 m depths), a soil temperature profile (Th3-s; UMS GmbH, Munich, Germany; 0.05, 0.10, 0.20, 0.30, 0.50 and 1.00 m depths), and a heated rain gauge (until July 2014 model 10116 from Toss GmbH, Potsdam, Germany; afterwards model 15188 from Lambrecht GmbH, Göttingen, Germany; 1 m of height). These measurements were conducted at a frequency of 1 Hz and 30 min averaged until October 2012. Afterwards 1 min averages were recorded. These data, which were aggregated to 30 min resolution, were used to support the flux data gap filling and partitioning and to drive the SPA-Crop model (Sect. 2.2.5).
2.2.4 Estimation of net biome production
NBP was used to determine the C budget of the field between 2003 and 2016. Knowing the C exchange through turbulent CO2 fluxes (NEE), C exports by harvest (Eharvest) and C imports by organic fertiliser (Ifertiliser), sowing (Isowing) and other possible pathways (Iother), NBP can be calculated as
We use the same sign convention as Buysse et al. (2017): when the field is a C source, NBP is positive, while it is negative if it is a C sink. For the contributing terms, C imports into the ecosystem are negative and exports positive. The term Iother can be relevant in rice paddies where methane fluxes are important (Nishimura et al., 2008) and at sites where substantial losses via volatile organic compounds (VOCs) or dissolved organic carbon (DOC) losses have to be taken into account. At the CH-Oe2 site, however, neither of these fluxes is of relevant magnitude, and Iother can be neglected. While VOC emissions (methanol) had been investigated at the nearby CH-Oe1 grassland site (Brunner et al., 2007) and were found to be very small compared to CO2 fluxes, no estimates have been done for DOC at CH-Oe2 so far. A dye tracer experiment by Alaoui and Goetz (2008) at CH-Oe2, however, indicated that the high clay content actually limits the leakage to lower soil layers well beyond the ploughing depth, and hence we do not account for potential DOC losses. Cumulative NBP (NBPcum) can then be calculated for our site as
where t0 and t are the starting and end dates of the period of interest, respectively. The first term of this equation is the cumulative NEE (NEEcum).
2.2.5 Modelled net ecosystem exchange
In order to quantify the impact of the cover crop on the C budget, the Soil–Plant–Atmosphere Crop Model (Sus et al., 2010) was used to simulate NEE under the same meteorological conditions but without the cover crop (i.e. bare soil). The model simulates cropland ecosystem photosynthesis and water balance at point scales over fine temporal (half-hourly) and vertical scales (10 canopy and 20 soil layers). The SPA-Crop simulation of heterotrophic respiration, modelled independently of crop type, includes decomposing surface litter and soil organic C (SOC) pools. The simulations were applied for the three available cover crop periods by running the model for the entire previous year (not shown) until the end of the cover crop season. The results were then compared to the corresponding eddy covariance NEE observations.
3.1 Carbon budgets over 13 years

Figure 2Daily cumulative net biome production (NBPcum) between 16 October 2003 and 11 October 2016. The black dashed line connects NBPcum at the end of each crop season. During time periods with a grey background, the field was bare (from harvest of a crop to sowing of the next crop or from first ploughing after sowing of a crop to sowing of the next crop if the first crop was not harvested).
For all crops, the season (defined from sowing of one crop to the sowing of the following crop) started with a net release of CO2 until the crop had emerged and became established, after which GPP began to exceed Reco (Fig. 2). A few weeks before harvesting when senescence started, Reco exceeded GPP again, resulting in a net CO2 release. At the point of harvest, C was exported from the ecosystem, which can be seen in most years as a sharp increase in NBPcum. Organic fertilisation with solid or liquid manure and sowing were C imports into the ecosystem. However, only solid manure applications were large enough C imports to be seen as a sharp decrease in NBPcum. While the field was bare, it was almost only respiring and therefore NBPcum increased during these periods. The voluntary regrowth after the harvest of rapeseed (2008 and 2013) resulted in an approximately 2-month-long period of uptake in the autumn of the same years.
For peas, the period of net C uptake was quite short (less than 1 month in contrast to 3 to 4 months for the other crops), which is due to their short growing period as they were peas for canning and were therefore harvested relatively early. The period of net C uptake is barely visible during the pea season in 2016 because the field was flooded due to extensive rain. Cover crops were only growing in the autumn, resulting in a relatively weak CO2 uptake followed by a relatively long period of net CO2 loss during winter season.
NBPcum at the end of each season mostly increased over time. Only during the potato season in 2006, without harvest due to the hail damage and during the crop rotation cycle (wheat, barley and rapeseed) between 2010 and 2013, did the NBPcum stay almost constant. NBPcum of the first crop rotation cycle (wheat, barley, cover crop, potato; 2003–2006) was 236 g C m−2. Between 2006 and 2009, wheat was repeated every second year. During the first 2-year period (wheat, rapeseed), the field was a net source of 302 g C m−2 and during the second 2-year period (wheat, cover crop, peas) a net source of 396 g C m−2. During the next full crop rotation cycle (wheat, barley, rapeseed; 2010–2013), the field was close to C neutral (NBP = −22 g C m−2), while it was a net source of 748 g C m−2 during the last crop rotation (wheat, barley, cover crop, peas; 2014–2016). The cumulative net biome production (NBPcum) for the 16 crop seasons between autumn 2003 and autumn 2016 shows that there was a net C loss of 1674 g C m−2 over the 13 years of study (Table B2). The field lost on average 129±50 g C m−2 of C per year (unless stated otherwise, we report mean ± standard error except for soil C and N values, for which mean ± SD is given).
Soil C densities (ρC) in the top 12 cm of the field were 0.0355±0.0042 g cm−3 (mean ± SD) in 2004 and decreased significantly (p<0.0001) on average by 18.0 % to 0.0291±0.0031 g cm−3 until spring 2017 (average over the top 15 cm and over all measurement days in 2017). The bulk density of the same layer increased insignificantly (p=0.25) from 1.16±0.08 g cm−3 in 2004 to 1.21±0.14 g cm−3 in 2017. The soil C stock decreased significantly (p<0.0001) on average by 775 g C m−2 in the top 12 cm from 4263±507 g C m−2 to 3488±374 g C m−2. At the same time, N stock changes were not significant over the 13 years (372±53 in 2004, 382±44 g N m−2 in 2017, p=0.19). There were no measurements from deeper soil layers available for 2004. However, measurements in 2017 show that C densities did not vary significantly (adjusted p=0.959) in the top 30 cm (Fig. 3). Ploughing was also done in most years to a depth of 30 cm. If we therefore assume that C stocks changed equally over a depth of 30 cm between 2004 and 2017, the soil C stock decreased in the top 30 cm layer on average by 1980 g C m−2. This corresponds to an annual average loss of 152 g C m−2.
The application of slurry caused such a small C input that it was not only invisible in NBPcum (Fig. 2) but was also not detectable in the soil. Soil C density measurements before and after the application of the slurry in 2017 did not reveal any significant (adjusted p>0.05) changes (Fig. C1). The slurry added only 25.4 g C m−2 and 4.7 g N m−2 to the soil. When comparing these numbers to the C and N stock of the top 30 cm of the soil, it can be seen that the C and N input is negligible.
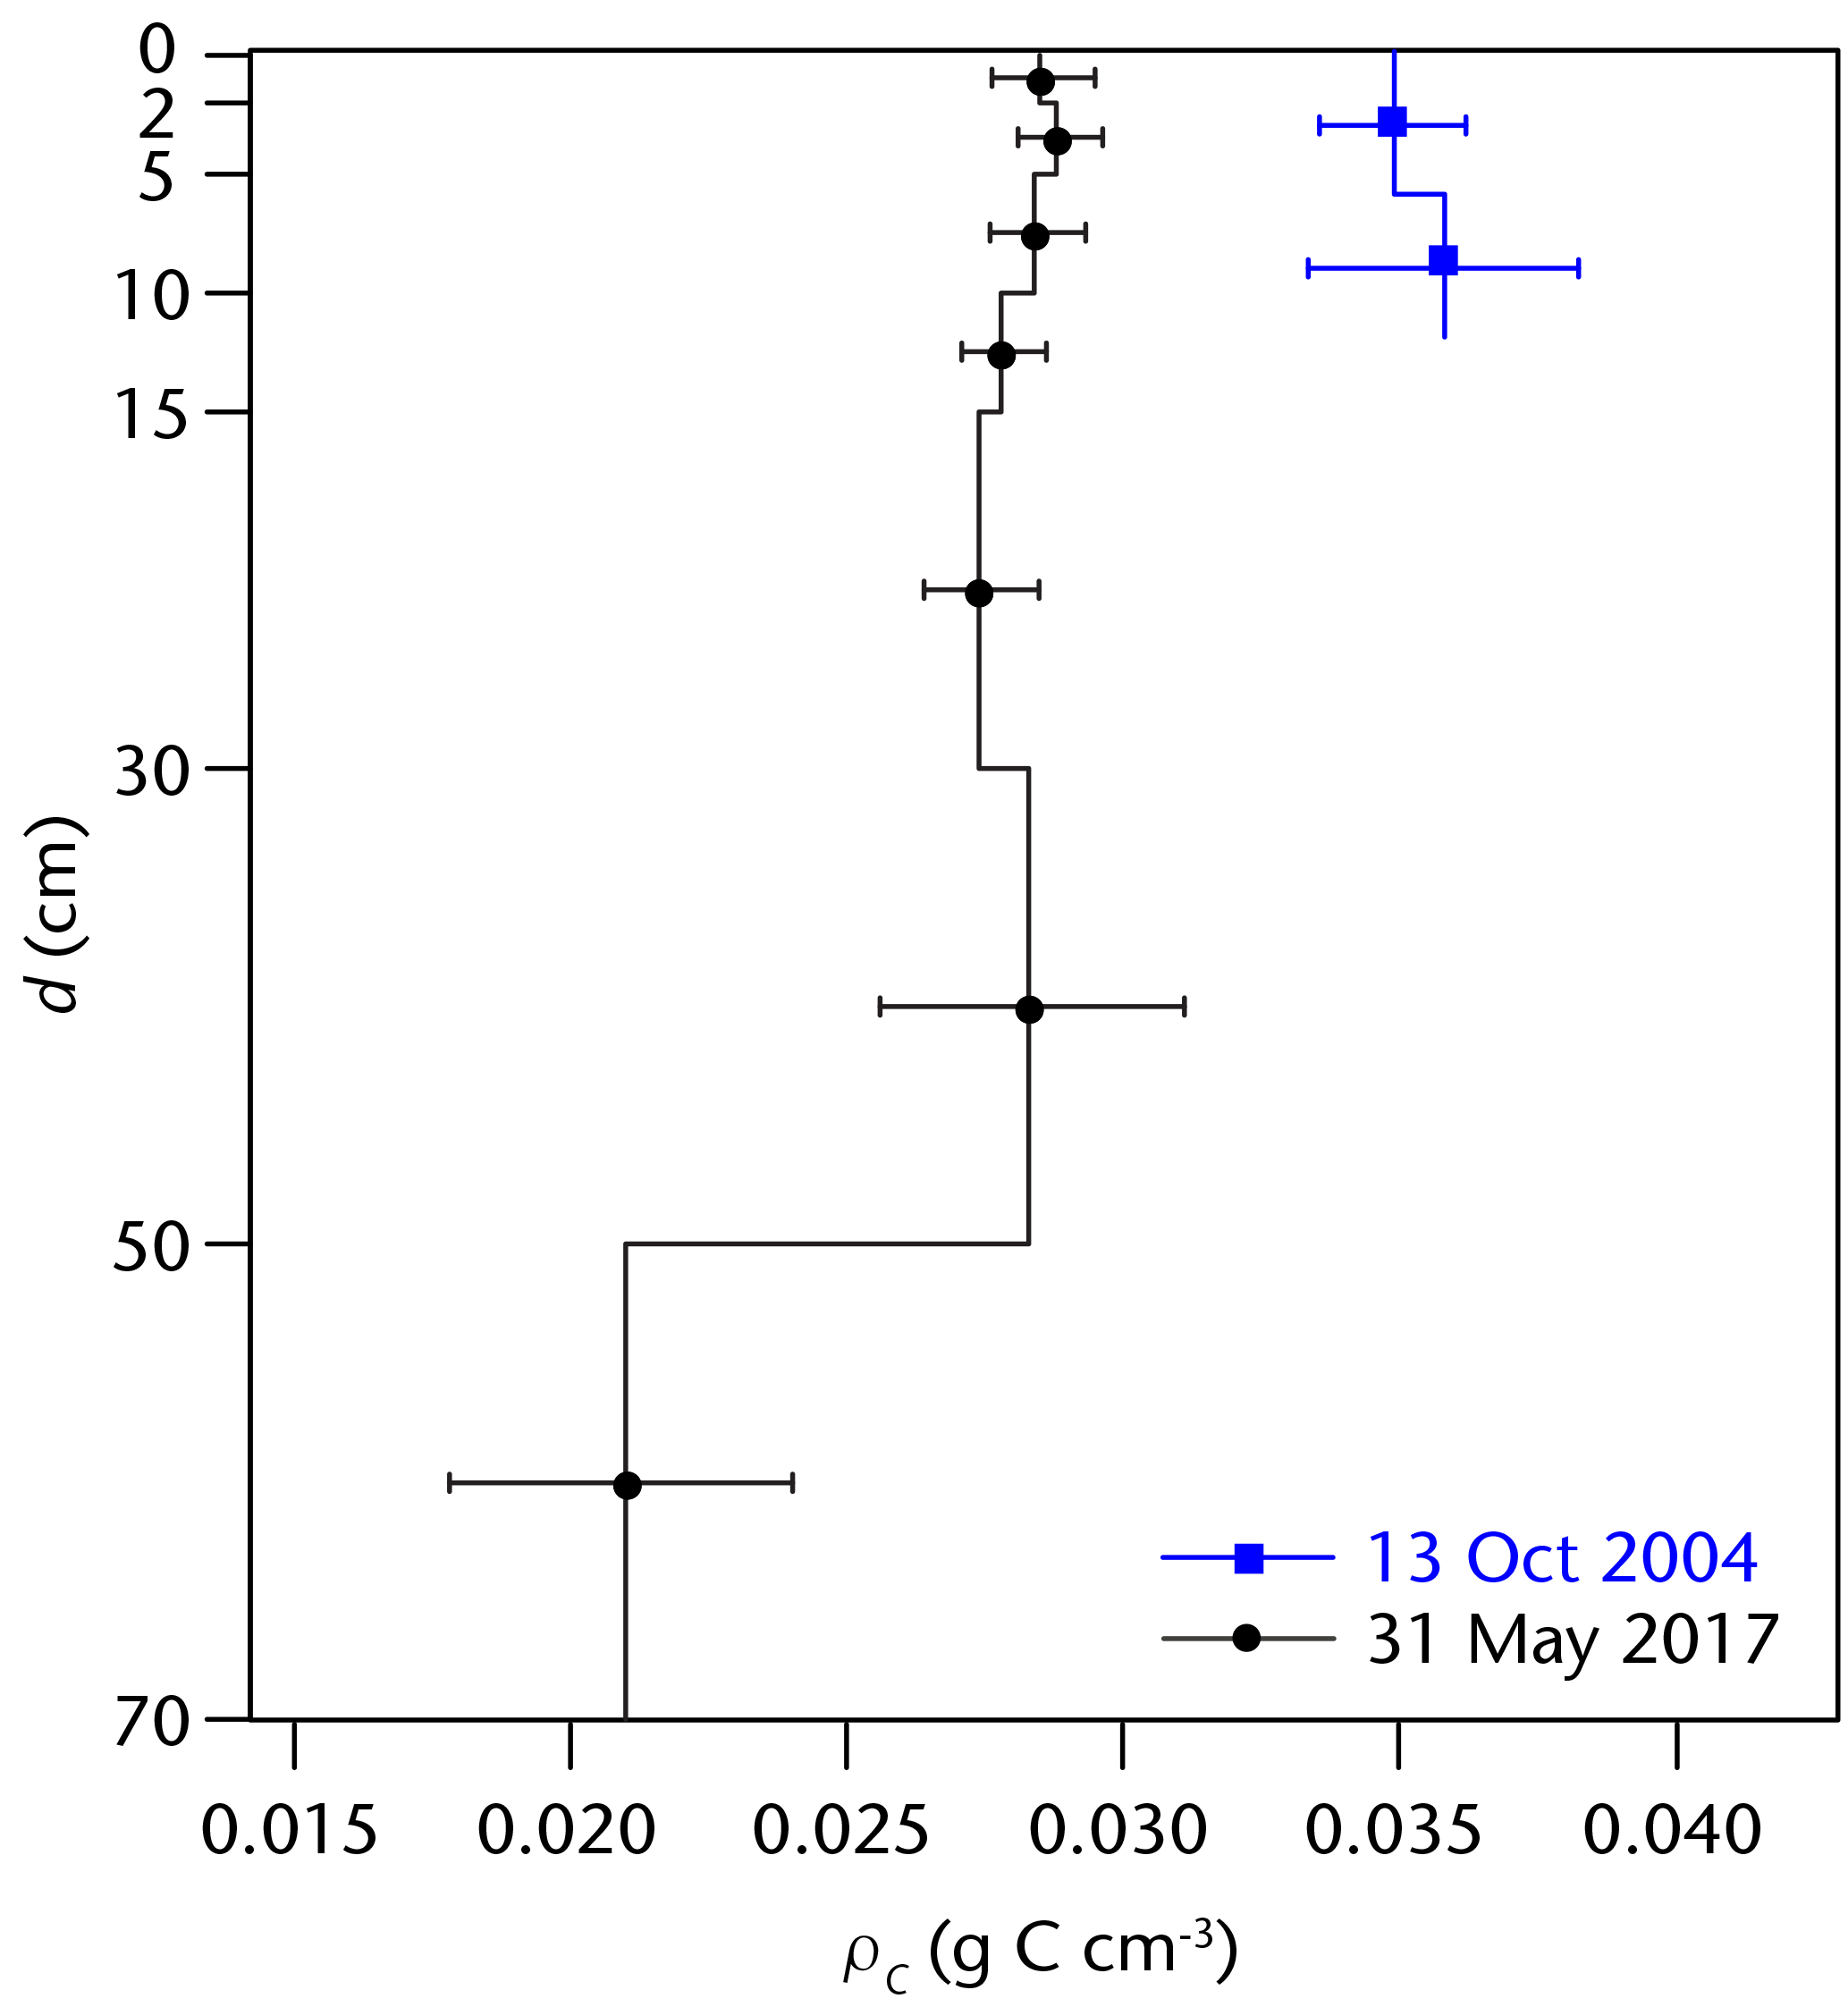
Figure 3Average soil carbon density (ρc) for different depth layers on 13 October 2004 and 31 May 2017. Error bars show standard errors.
The field site was clearly a C source, which was also confirmed by the changes in soil C stocks measured at the beginning and at the end of the measurement period. Depending on the measurement method, the field lost 15.7±4.0 % (based on NBPcum and soil C stock of top 30 cm in 2004) to 18.0±5.3 % (based on soil C stocks in 2004 and 2017, uncertainty is based on standard errors) of C over the 13 years. The differences between the C budget determined by calculating NBP and by measuring C stocks in the soil were remarkably small given that these results are based on two completely independent measurements. The loss strength, however, was likely influenced by the arable–ley rotation, which was used at the field until the late 1990s and which is expected to reach a higher soil C stock than the crop rotation that was used afterwards.
Ceschia et al. (2010) studied the annual NBP (138±239 g C m−2 yr−1; they call it net ecosystem C budget) and the annual changes in soil C stocks of the top 30 cm (2.4±4.7 % year−1) of European croplands (averaging over 17 croplands and 41 site years ± SD deviation, between 1 and 5 consecutive years per site). In contrast to our results, their findings were not significantly different from a C neutral budget. However, our results were within the range found by Ceschia et al. (2010). Kutsch et al. (2010) determined an average annual NBP of 95±87 g C m−2 yr−1 for five crop rotation sites and two monoculture sites. There are a number of other studies on European crop fields with crop rotations that found similar or slightly higher annual losses to what we found in this study (Buysse et al., 2017; Prescher et al., 2010). A modelling approach based on soil stock measurements for European croplands also resulted in comparable average annual C losses of approximately 90±50 g C m−2 (Janssens et al., 2003). On the other hand, research using a process-based model and soil C inventories (Ciais et al., 2010) and a study combining ecosystem-scale measurements with atmospheric greenhouse gas measurements and an inversion model (Schulze et al., 2009) found an average annual source of 8.3±13 to 13±33 g C m−2 yr−1 and 10±9 g C m−2 yr−1, respectively, for croplands. In our study, the management under the regulations of PEP did not result in a neutral C budget or C sink and also not in a significantly smaller average annual loss compared to other European croplands. However, soil N stock measurements showed that the neutral N budget, as required by PEP, was approximately reached.
An uncertainty estimate of NBP calculated with Eq. (1) can be found in Appendix A. In total, the uncertainty adds up to a maximum uncertainty of approximately ±25 % of NBPcum. Buysse et al. (2017) listed in detail the uncertainties involved in the different NBP terms in their study, which would add up to a maximum uncertainty of 220 g C m−2 over the 12 years of their study (at NBP = 990 g C m−2), corresponding to an uncertainty of 22 %.
3.2 Crop-specific budgets
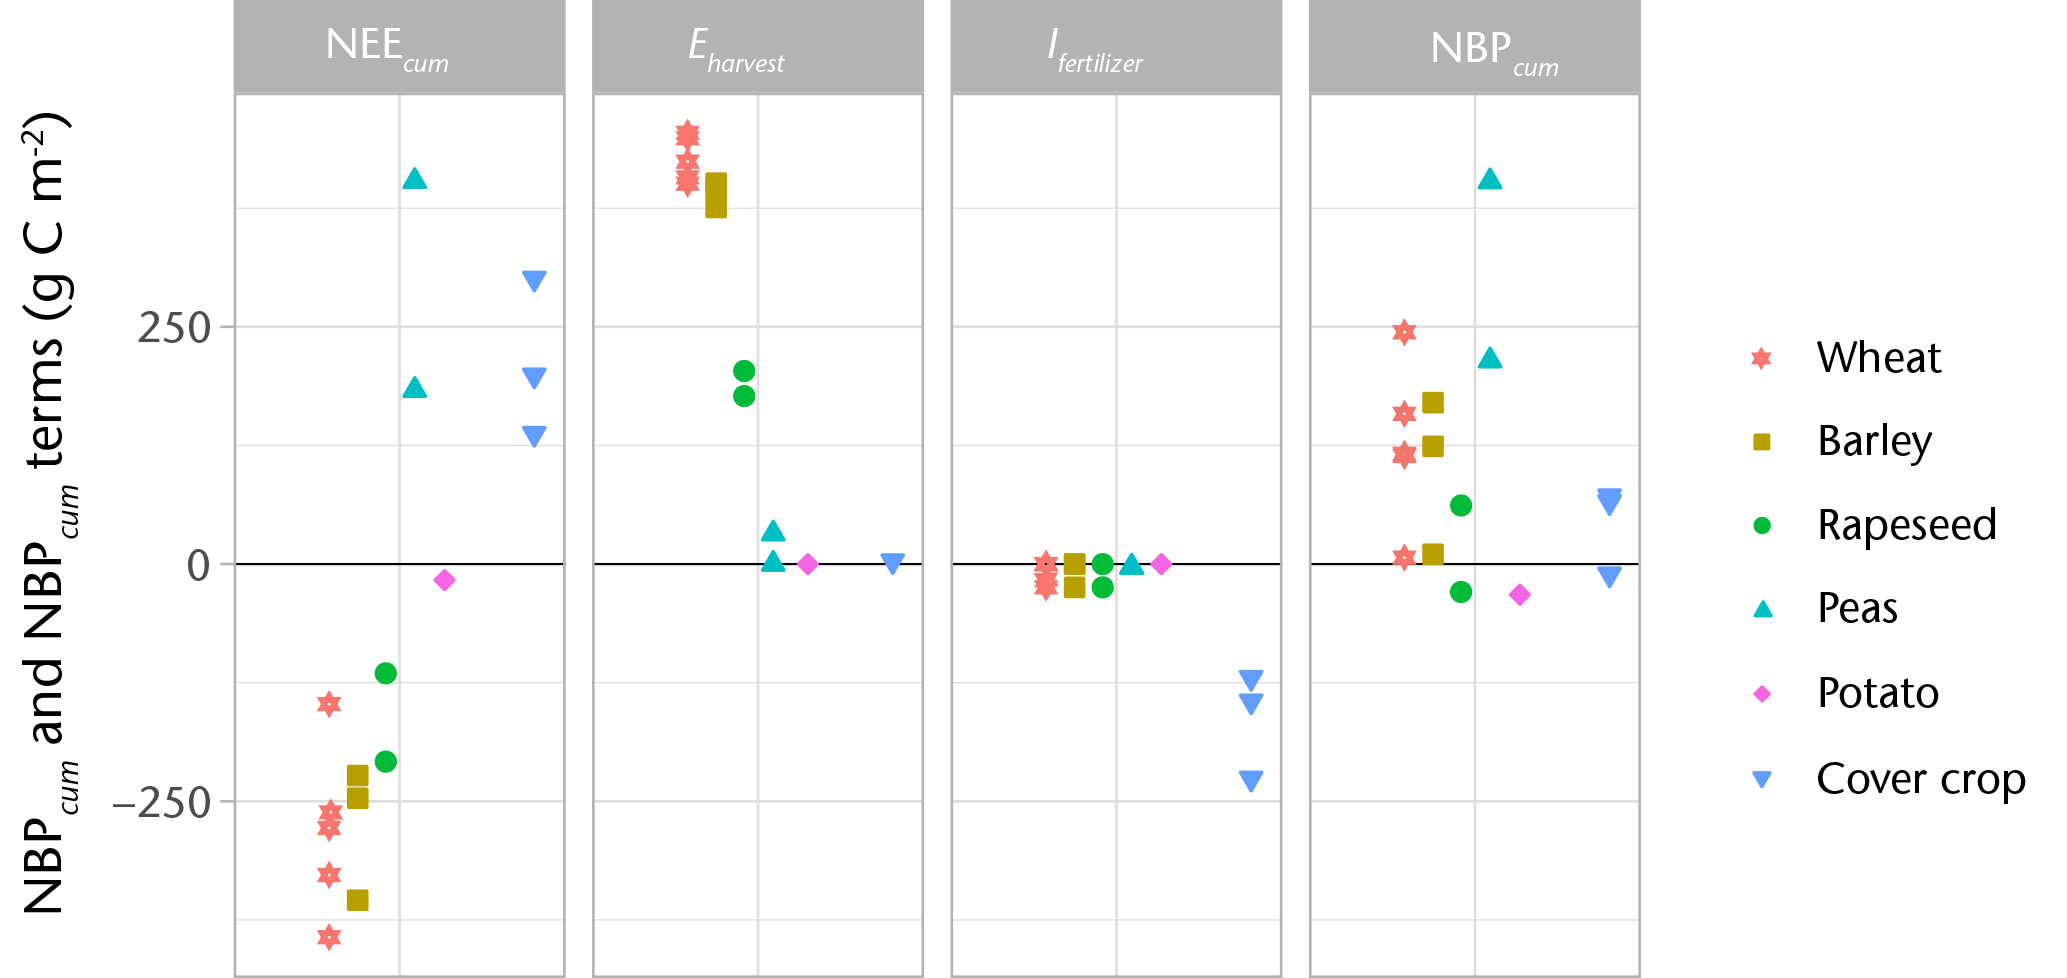
Figure 4Crop-season-specific cumulative net biome production (NBPcum) and the main contributing terms: cumulative net ecosystem exchange (NEEcum), C export by harvest (Eharvest) and C import by fertiliser (Ifertiliser). Each symbol stands for one crop season. Not shown is the C import by sowing (Isowing), which is negligibly small except for potatoes. It is, however, included in the calculation of NBPcum. Please note that cover crops were only grown during autumn and winter.
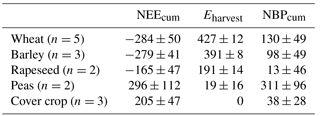
Table 2Average and standard error of cumulative net ecosystem exchange (NEEcum), C export through harvest (Eharvest) and cumulative net biome production (NBPcum) in g C m−2 season−2 of the five crop types with more than one season. The number (n) of seasons for each crop type is given in parentheses. Please note that cover crops were only grown during autumn and winter.
Wheat and barley showed the largest net C uptake from the atmosphere over the crop season and also had the largest C export through harvest (Fig. 4 and Table 2). They were followed by rapeseed, which also had less C exported through harvest. Peas assimilated less C from the atmosphere than the ecosystem released at the same time, and very little was exported from the field during harvest. During winter seasons with cover crops, more CO2 was also lost to the atmosphere than was taken up by the ecosystem. For all crops, Isowing was very small to negligible (<15 g C m−2, Table B1). The application of slurry also resulted in rather small imports of 16 to 25 g C m−2, whereas solid manure imported 123 to 229 g C m−2 (Tables 1 and B1).
Taking into account NEEcum, Eharvest, Ifertiliser and Isowing, NBPcum of most crop seasons was positive. Pea seasons showed a substantially larger overall C loss than the other crops. Most other crop seasons ranged between close to zero and 160 g C m−2. Since the potatoes were not harvested and did not receive a fertiliser application, this resulted in the only season that had an almost neutral C budget. For one season (2007–2008) rapeseed was a weak C source and a very weak C sink in the other season (2012–2013). Cover crops were only on the field from the late autumn until the early spring, when less light was available for growth and conditions were generally colder compared to those of the other crops. Their relatively large C loss to the atmosphere was thus a result of the winter growing season, not of the crop type, and was strongly compensated for by the application of solid manure. Solid manure was always applied at the end of the cover crop seasons. This was done to compensate for the expected C losses during the following pea season, which are often referred to by farmers as consumers of soil organic C. Therefore, it could be argued that the application of solid manure should be attributed to the following pea season instead of the cover crop season. With the crop season defined as the time range between the first ploughing after the harvest of the previous crop to the first ploughing after the harvest of the current crop, all crops (except potatoes and one barley season) would be in a more similar range (peas: 124 g C m−2 in 2010 and 181 g C m−2 in 2016; Fig. D1). The attribution of the manure application to the pea season is also discussed in Gilmanov et al. (2014). The reduction of the net C loss during the pea season due to the solid manure application shows that the application of solid manure before the growth of peas is useful to compensate for the loss of C during these seasons, although it can only partly offset the C losses.
Our results for winter wheat and winter barley are comparable to what was found in Europe for these crop types (Ceschia et al., 2010). There are very few studies looking at rapeseed or peas. For winter rapeseed (in Germany) and peas (in France), Ceschia et al. (2010) reported values of NEE = −306 and 278 g C m−2, Eharvest=560 and 98 g C m−2, and NBP = −2 and 375 g C m−2, respectively, including only one season per crop type. In our study rapeseed assimilated less C in both seasons and less C was also exported with the harvest; however, NBP was again comparable. For peas, NEE was comparable to NBP because the export with the harvest was much smaller than for all other harvested crops. This could be related to the fact that the peas cultivated at CH-Oe2 were peas for canning, which are harvested when they are still relatively small. We are not aware of a study having investigated the C budget of potatoes that does not use data from our own site. The results of our potato season should not be considered representative for regular potato seasons due to the hail damage, which had major impacts on the management and the growth of the plants and resulted in no harvest. In our study, applying solid manure to the cropland was found to import substantial amounts of C to the ecosystem, while the import through liquid manure was very small. For a variety of European croplands, Ceschia et al. (2010) found that organic fertilisation tended to lower the C budget even though respiratory losses can slightly increase (less than 10 %) in the first month after the application of solid manure (Eugster et al., 2010).
3.3 The effect of cover crops
During the winter seasons with cover crops, there was always a net C loss. This loss, however, could have been larger not having a crop on the field at all. Having a crop on the field allows for C uptake through photosynthesis; however, autotrophic respiration (by the plants) and heterotrophic respiration (by providing more soil C matter to decompose) will also be enhanced. Depending on whether photosynthesis or respiration is enhanced more, a cover crop may be beneficial in the context of the C budget. In order to assess the benefit of having a cover crop, the CO2 exchange of the field without a crop (i.e. bare field) was modelled with the SPA-Crop model. All other terms of NBP were kept constant since the cover crop was not harvested. SPA-Crop captures the CO2 exchange from the harvest of the previous crop until the start of the cover crop growth quite well (Fig. 5). In contrast to tropical regions (Powlson et al., 2016), where climate during cover crop seasons is not a limiting factor, the field experienced a net loss of C during the cover crop seasons due to the less favourable climate (colder and less light) on the Swiss Plateau in autumn. Nevertheless, in all three seasons, the field with a cover crop is overall a smaller net C source than the bare field, even though the NEEcum difference covers a large range of 11 to 163 g C m−2. The cover crop seems to be clearly beneficial (GPP increases larger than Reco increases) in reducing C losses during fallow periods. Furthermore, substantial amounts of C are introduced into the soil by incorporating the biomass at the end of the season when the field is prepared for the next crop. Ceschia et al. (2010) report that the voluntary regrowth of seeds and weeds after the harvesting of winter wheat at Avignon in the season 2005–2006 also reduced the C losses. In a recent review by Chenu et al. (2018) the use of cover crops was discussed. Similar to our findings they conclude based on a number of different studies that the use of cover crops is beneficial for soils because it results in higher soil organic C stocks compared to their absence. The result on cover crops at CH-Oe2 shows that the regulations of PEP requiring a cover crop during fallow periods improved the C budget of the field.
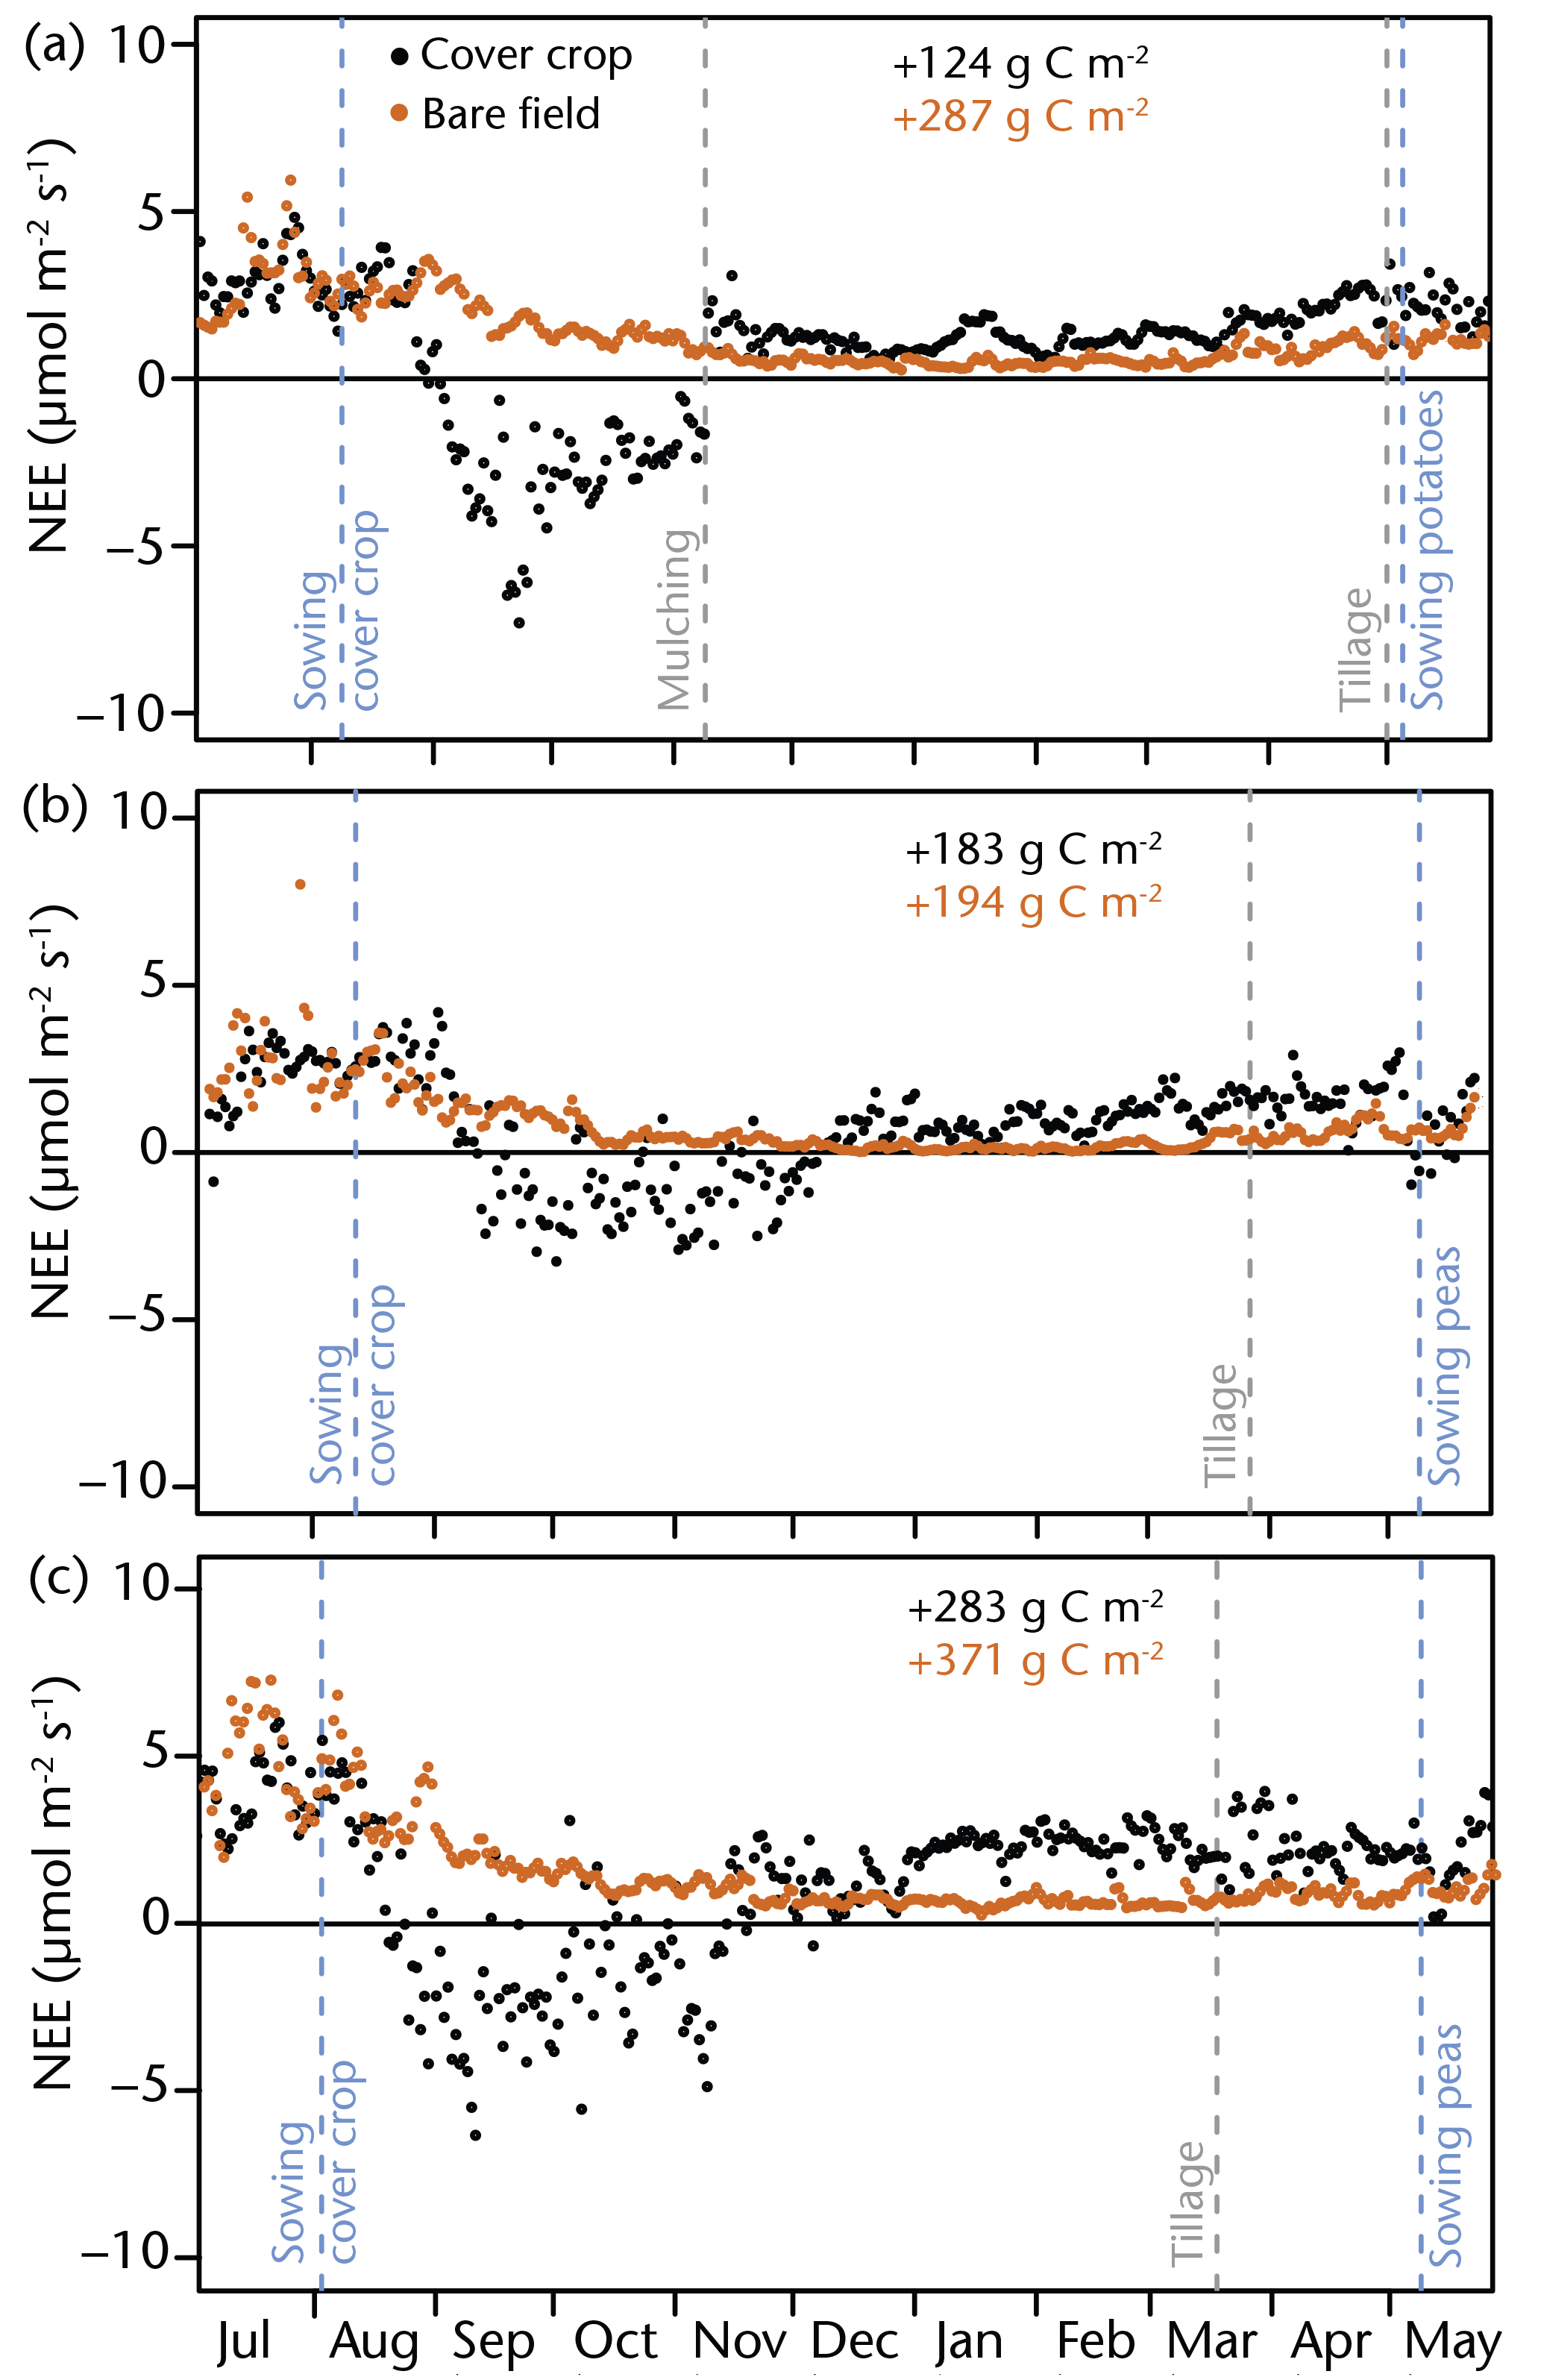
Figure 5Daily average NEE of the three cover crop seasons (a) 2005–2006, (b) 2009–2010 and (c) 2015–2016, displaying measured data with cover crop and modelled data with a bare field. NEE was measured with an EC system, while modelled NEE was simulated with the model SPA-Crop. Vertical lines indicate sowing, tillage and mulching dates. Numbers in the top right corner of each subfigure are the cumulative NEEs of the field with cover crop in black and bare field in brown.
3.4 Solid manure can at least partly compensate for the C losses
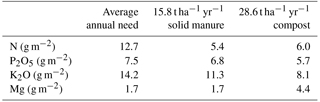
The more frequent use of solid manure could compensate at least partly for the C losses of the crop field and decrease or prevent the loss of soil fertility. Assuming the same average C loss rate for the future but without any organic fertiliser application (also no slurry), the average annual loss would be 174 g C m−2. The average C concentration in solid manure at CH-Oe2 was 440 g kg−1 dry mass (Table E1). Based on these numbers an annual manure application of approximately 15.8 t ha−1 would compensate for the C losses without any further slurry applications if we assume no increase in Reco. The regular application of solid manure could also reduce the amount of mineral fertilisers applied to the field because substantial amounts of N, phosphorus pentoxide (P2O5), potassium oxide (K2O) and magnesium (Mg) would be supplied by the solid manure (for N approximately half and in all other cases close to the needs as given by the fertilisation plan of the Landwirtschaftliche Beratungszentrale Lindau LBL, 2005, averaged over all crop seasons). The application of compost instead of solid manure should be considered if not enough solid manure is produced by the farm. We estimate that 28.6 t ha−1 of compost would be needed to compensate for the average annual C losses assuming that the net fluxes of compost are similar to manure. Also, in the case of compost, large fractions of the N, P2O5 and K2O needs would be met. On the other hand, Mg would be overfertilised. This is, however, only a rough estimate because the composition of compost and manure can vary substantially. Furthermore, the manure amount needed to compensate for C losses should be seen as a lower limit because several studies in Switzerland have shown that the C loss reduction can be much less than the C input through manure (Leifeld et al., 2009; Maltas et al., 2018; Oberholzer et al., 2014), which also likely applies to compost. Including ley in the crop rotation could also be considered to compensate for C losses. According to Maltas et al. (2018) green manure or cereal straw application can also be effective measures to prevent or reduce soil degradation, while solid manure has the highest C loss reduction efficiency (compost was not included in the study).
Switzerland's nationally determined contribution (NDC) to the reduction in greenhouse gas emissions lists zero emissions from non-forest lands like croplands (NDC, 2017). Therefore, the C losses should be reduced from a climate change point of view. The use of organic fertilisers could help in coming closer to meeting the goal. In the case of CH-Oe2, the grains, peas and potatoes were not used to feed animals on the same farm. However, straw produced on the field at a rate of 78 g C m−2 yr−1 (1013 g C m−2 in total during the 13 years of measurements) is used on the farm. If this straw had been added back to the field (either directly or included in solid manure), it could have compensated for a fraction of the C losses over the 13 years. Ammann et al. (2007) studied the C exchange of the neighbouring grassland managed by the same farm. Intensive management of the grassland fertilised with liquid manure (mixture of cow dung and urine) from the same farm resulted in a significant uptake of C. Because the grassland was a C sink it could have been considered to apply the manure to CH-Oe2 instead to counteract the higher C loss of the arable field. Therefore, we assume that there is a potential to decrease the field's C losses substantially by increasing the application of the farm's own solid manure to the field. In order to determine if the application of manure would improve the greenhouse gas budget of the cropland as listed by Switzerland's NDC, it would require a complete life cycle assessment which goes beyond the scope of this study.
Table 3Nutrient requirements and input: average annual need based on the fertilisation plan (Landwirtschaftliche Beratungszentrale Lindau LBL, 2005), the input of the same nutrients with the annual application of 15.8 t ha−1 yr−1 of solid manure (based on the average concentrations of solid manure given in Table E1) and the annual application of 28.6 t ha−1 yr−1 of compost (Landwirtschaftliche Beratungszentrale Lindau LBL, 2005), corresponding to an approximate Corg input of 174 g m−2 yr−1. For N an efficiency of 60 % was assumed for manure and for compost as required by the regulations of PEP in the case of farmyard manure (Amaudruz et al., 2014).
The combination of direct eddy covariance measurements and management records provided a unique dataset to study the long-term C budget of the crop field over 13 years. The field was managed under the Proof of Ecological Performance (PEP) regulations that shift the focus from purely economical to more ecological. Our goal was to assess whether the PEP regulations resulted in a more sustainable C budget.
Our study showed that the crop field was a source of C of 1674 g C m−2 over 13 years (129 g C m−2 per year), which was also confirmed by changes in the soil C stock in the top 30 cm. The loss corresponds to a soil C stock loss of 16 % to 19 % over these 13 years of study.
Overall, NBP of most crop seasons was positive (i.e. the field lost C), while the C loss during pea seasons was the largest.
Liquid manure had a too-small C content to compensate for the C losses of a whole crop season. Contrastingly, solid manure imported similar C amounts into the ecosystem as the C uptake through the NEE of the cereal and rapeseed crops.
The field was a net C source during cover crop seasons, but model simulations showed that the source was smaller than if the field had been left bare between the autumn and spring before a summer crop was sown.
Managing the field under the regulations of PEP did not result in a long-term C sink. However, some aspects of the regulation seem to improve the C budget of croplands. Even though the application of slurry had very little influence on the C budget, fertilisation with solid manure and the sowing of cover crops during fallow periods provide a potential means to close the C budget of this crop field. More effort than only applying PEP is necessary to reach not only an N neutral but also a C neutral budget and to meet Switzerland's NDC. The more frequent application of solid manure or compost should be considered to at least partly compensate for the C losses with the side effect of reducing the need for mineral fertilisers.
Observational NEE (30 min and daily aggregated; original, despiked and gap filled), SPA-Crop modelled daily NEE, soil C and N concentrations, soil C and N densities and soil bulk densities, management data (including management dates, crop species, management specifics, harvest C exports, and sowing and fertiliser C inputs), and ancillary meteorological data are available under https://doi.org/10.3929/ethz-b-000260058. Also, NEE uncertainty calculations and analysis of the significance of soil bulk density, soil C and N density, and soil C and N stock changes between 2004 and 2017 as well as data that were plotted in the figures and shown in the tables are also available under https://doi.org/10.3929/ethz-b-000260058.
Several corrections were applied during the calculation of NEE to avoid errors and biases. However, there might still be sources of uncertainties for NBPcum, which are listed in the following.
The uncertainty of NEEcum related to the u* filtering was assessed within REddyProc by determining the 5th and 95th confidence interval for the u* threshold. The gap-filled NEEcum values using the generally applied u* threshold were then compared to the gap-filled NEEcum based on the 5th and 95th confidence interval for the u* threshold. This resulted in an uncertainty of −271 to +213 g C m−2 over the 13 years. The uncertainty due to gap filling was assessed by comparing the regularly gap-filled NEE using the regular u* filter to a gap-filled NEE for which all half hours were gap filled (a variable computed with REddyProc). The difference in NEEcum was 32 g C m−2 for the 13 years.
The uncertainty of Isowing can be neglected since Isowing itself is already very small. The uncertainty of Ifertilizer is dominated by the uncertainty of the solid manure import (liquid manure imports are small). The uncertainty of the solid manure weight is 5 % according to the farmer and combined with the uncertainty of the elemental C measurement, this results in an uncertainty of ±70 g C m−2 for the 13 years. The uncertainty of Eharvest is dominated by the possible loss of harvest material during cleaning before weighing. This loss can be up to 3 % of the yield, which results in a possible underestimation of Eexport of 99 g C m−2. The uncertainty due to the balance uncertainty and the elemental C uncertainty adds up to ±31 g C m−2 for the 13 years.
Assuming that all these uncertainties add up, the maximum uncertainty of NBPcum calculated with Eq. (1) adds up to −404 to +445 g C m−2, corresponding to a relative uncertainty of 24 to 27 %. Realistically, however, the uncertainty is lower because it can be assumed that some of these uncertainties will cancel each other out.
Table B1Seasonal carbon budget expressed as cumulative net biome production (NBPcum) and its contributing terms of the 16 full crop seasons between 2004 and 2016 (units: g C m−2). A season is defined as the period from the sowing of the current crop until the sowing of the following crop. NEEcum is the cumulative net ecosystem exchange, Eharvest is the C export through harvest, and Ifertiliser and Esowing are the C imports through organic fertilisation and sowing, respectively. The sums over all crop seasons are also given.
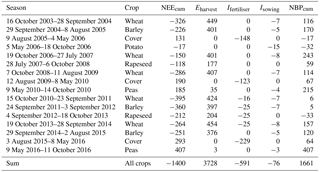
Table B2Annual carbon budget expressed as cumulative net biome production (NBPcum) and its contributing terms for the 13 crop years between 2003 and 2016 (units: g C m−2). A crop year starts here on 16 October of one year and ends on 15 October of the next year. This date was used because the first crop was planted on 16 October 2003. NEEcum is the cumulative net ecosystem exchange, Eharvest is the C export through harvest, and Ifertiliser and Esowing are the C imports through organic fertilisation and sowing, respectively. The total sum, annual average and standard error of each term are also given.
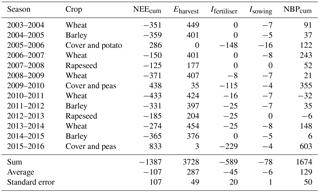
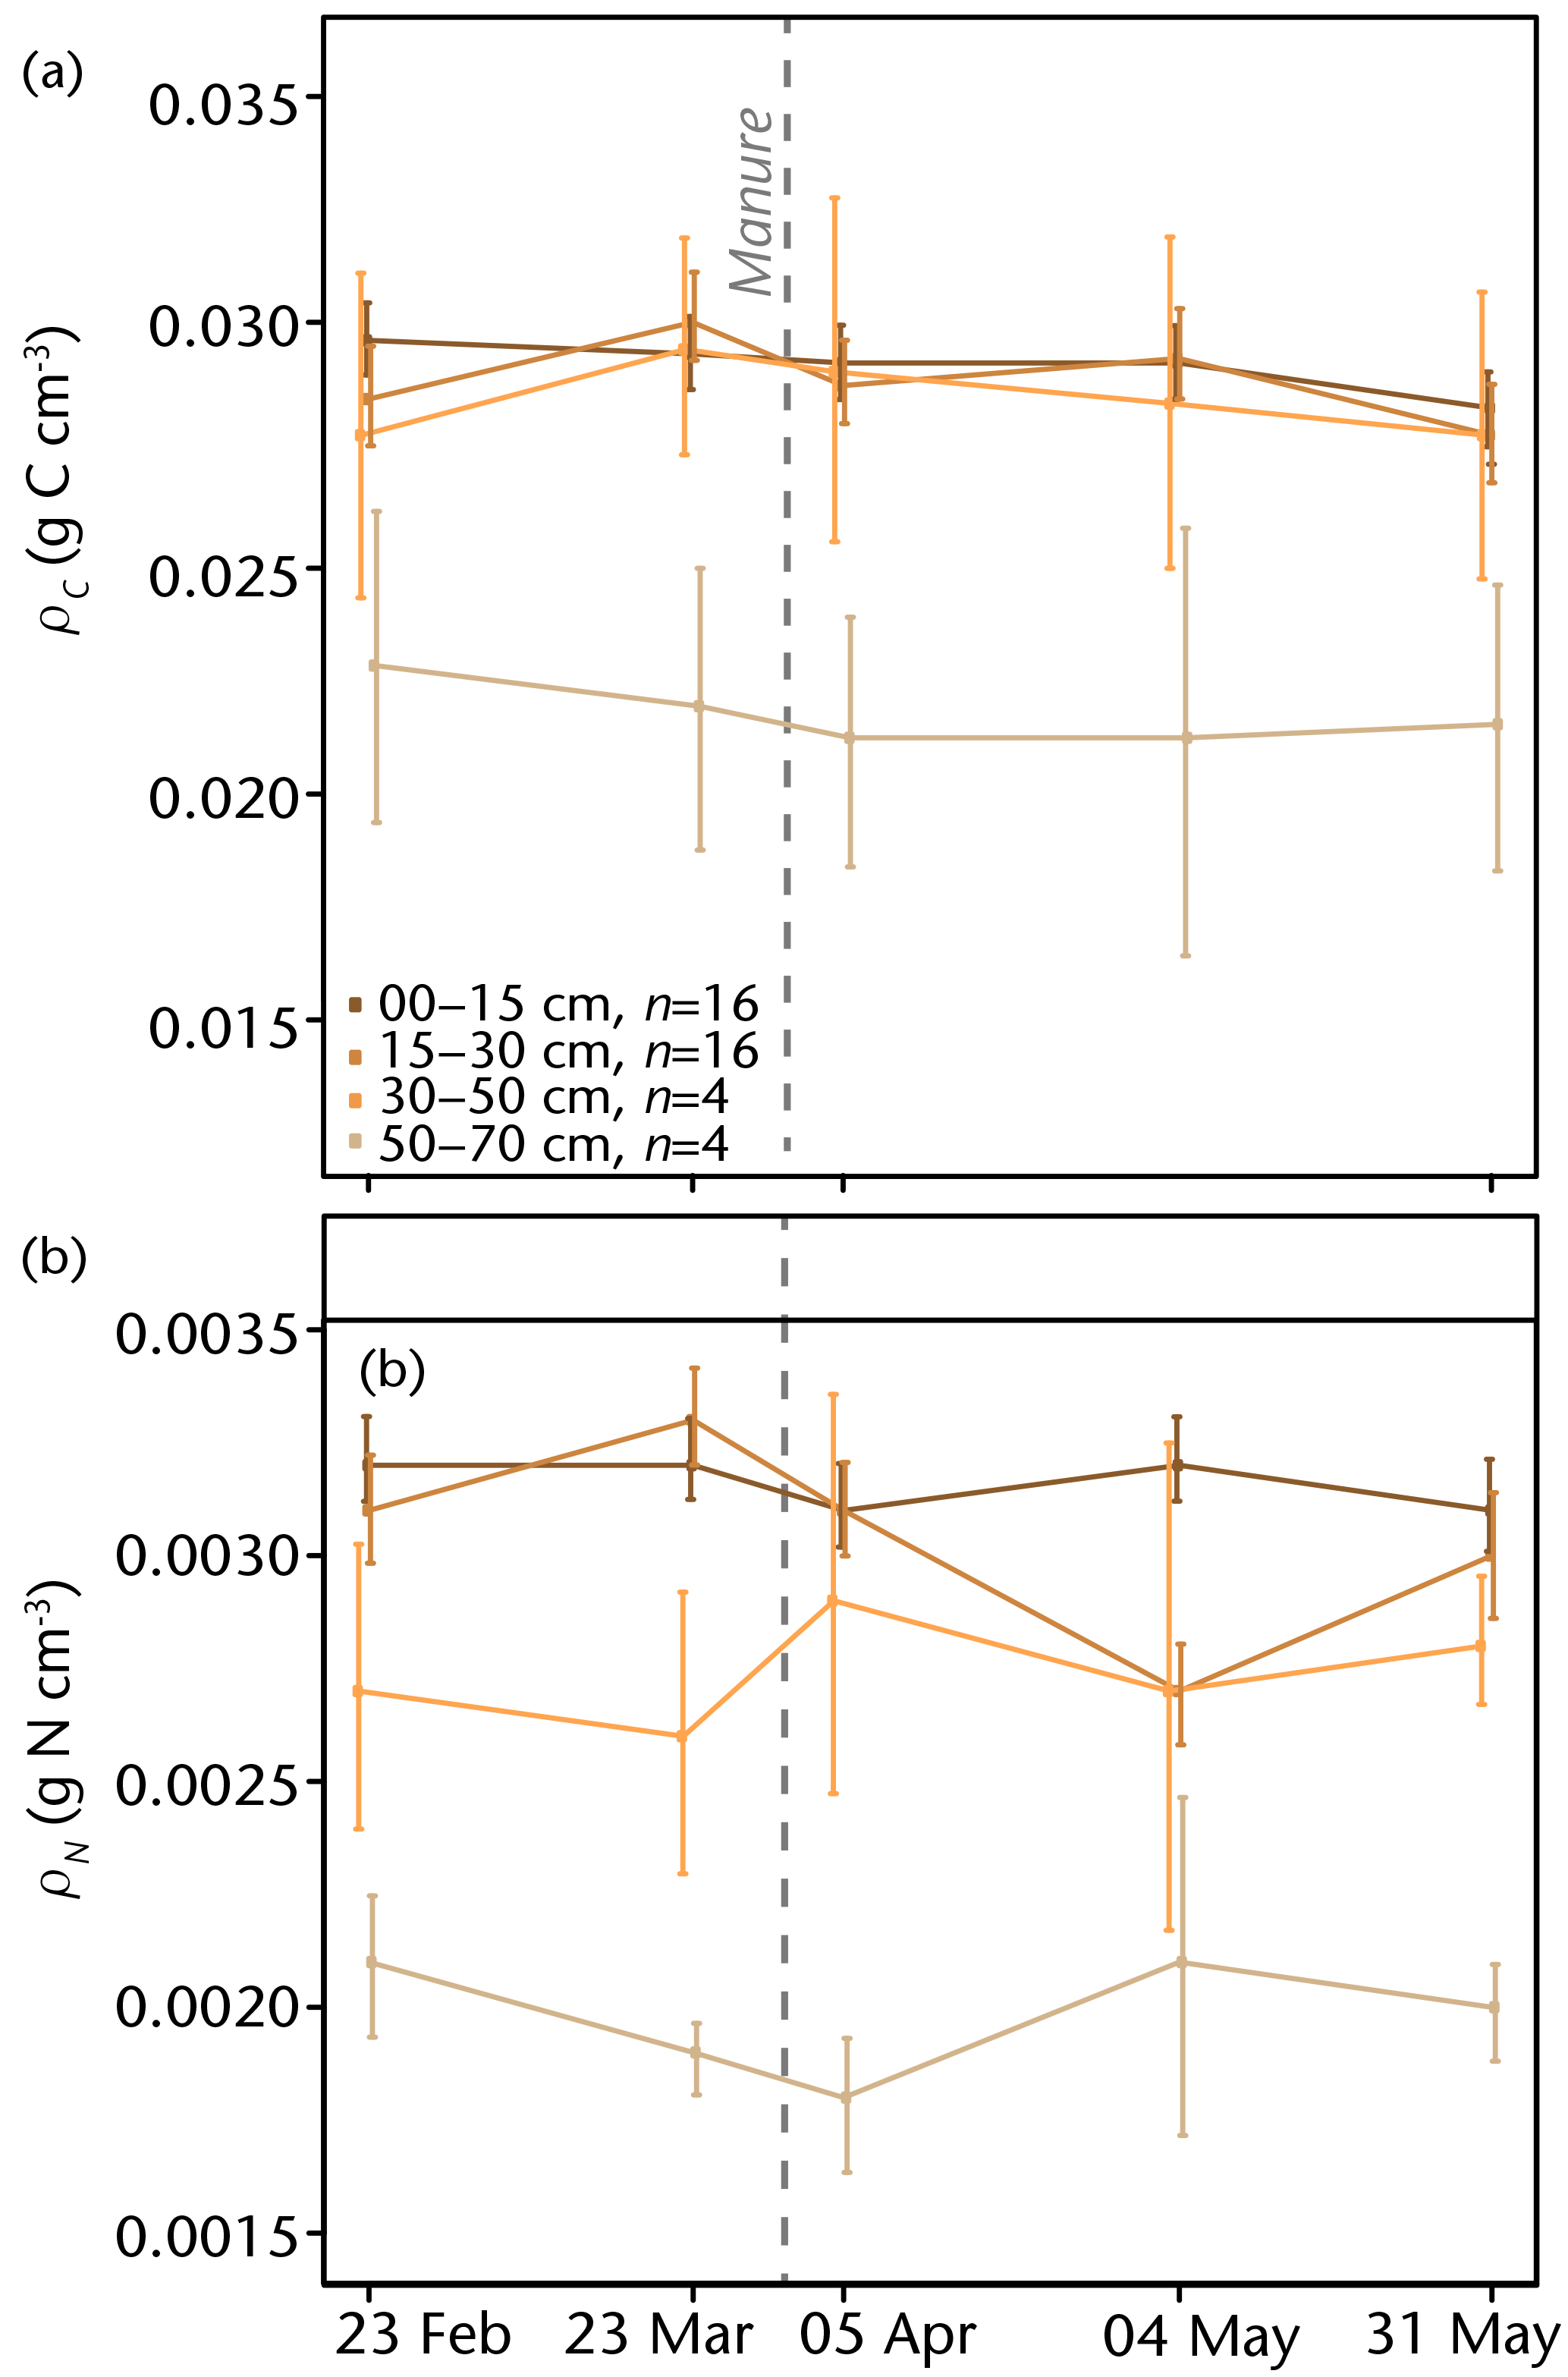
Figure C1Average soil carbon (a) and nitrogen (b) densities (ρC and ρN, respectively) in five different soil layers and on two days before and three days after the application of liquid manure in 2017. Standard errors are shown as error bars. The grey dashed line indicates the day of manure application. The number of samples (n) included in the averages is given in the legend.

Figure D1Crop-season-specific cumulative net ecosystem exchange (NEEcum) and net biome production (NBPcum) with a season defined as the time range between the first ploughing after the harvest of the previous crop and the first ploughing after the harvest of the current crop. Each symbol stands for one crop season. Please note that cover crops were only grown during autumn and winter.
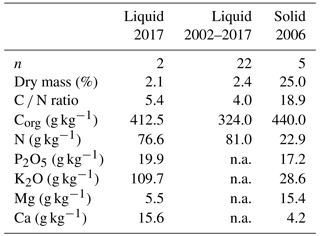
Table E1Average nutrient concentrations (per dry matter) of liquid and solid manure. The liquid manure data of 2017 are based on samples from 31 March 2017 and include all variables, while for the average over all liquid manure samples between 2002 and 2017 only dry mass, C and N data are available. The solid manure data are based on five samples on 24 January 2006. The number of samples included in the average is given as n. (n.a. means that the average of a nutrient concentration is not available.)
CE designed the study, conducted most parts of the analysis, and wrote and revised the paper. AW and CE designed and conducted the slurry application study in 2017. CA contributed parts of the field management and manure data. LH was involved in processing the eddy covariance measurements. WE conducted the uncertainty analysis of the elemental analysers and supported CE during all parts of the study. All co-authors were involved in writing and contributed to the study with feedback and critique.
The authors declare that they have no conflict of interest.
This project was funded by the Swiss National Science Foundation (SNF) grant 146373.
We thank the farmers Daniel and Walter Ingold for the management of the field and
providing information on the management, Agroscope for providing access to the field
site and infrastructure, and the involved technicians (Peter Plüss, Thomas Baur, Philip Meier,
Florian Kaeslin, Patrick Koller, Ivo Beck, Paul Linwood) and student helpers (Seyhan
Kâhya, Anja Taddei, Ewa Merz, Eva Penz) for maintaining the site, helping with the
measurements and summarising field information. We also thank Karin Grassow for taking
the soil samples in 2004, Annika Ackermann for performing the C and N elemental
analyses, and Christoph Bachofen for his statistical advice.
Edited by: Edzo Veldkamp
Reviewed by: two anonymous referees
Adachi, M., Ito, A., Ishida, A., Kadir, W. R., Ladpala, P., and Yamagata, Y.: Carbon budget of tropical forests in Southeast Asia and the effects of deforestation: an approach using a process-based model and field measurements, Biogeosciences, 8, 2635–2647, https://doi.org/10.5194/bg-8-2635-2011, 2011. a
Alaoui, A. and Goetz, B.: Dye tracer and infiltration experiments to investigate macropore flow, Geoderma, 144, 279–286, 2008. a, b
Allard, V., Soussana, J. F., Falcimagne, R., Berbigier, P., Bonnefond, J. M., Ceschia, E., D'hour, P., Hénault, C., Laville, P., Martin, C., and Pinarès-Patino, C.: The role of grazing management for the net biome productivity and greenhouse gas budget (CO2, N2O and CH4) of semi-natural grassland, Agric. Ecosyst. Environ., 121, 47–58, 2007. a
Amaudruz, M., Weyermann, I., Kessler, V., Nyffenegger, L., and Ofner, M.: Wegleitung Suisse-Bilanz, Bundesamt für Landwirtschaft, Bern, AGRIDEA, Lindau and Lausanne, Switzerland, 2014. a
Ammann, C., Flechard, C. R., Leifeld, J., Neftel, A., and Fuhrer, J.: The carbon budget of newly established temperate grassland depends on management intensity, Agric. Ecosyst. Environ., 121, 5–20, 2007. a, b
Ammann, C., Spirig, C., Leifeld, J., and Neftel, A.: Assessment of the nitrogen and carbon budget of two managed temperate grassland fields, Agric. Ecosyst. Environ., 133, 150–162, 2009. a
Anthoni, P. M., Knohl, A., Rebmann, C., Freibauer, A., Mund, M., Ziegler, W., Kolle, O., and Schulze, E. D.: Forest and agricultural land-use-dependent CO2 exchange in Thuringia, Germany, Glob. Change Biol., 10, 2005–2019, 2004. a
Aubinet, M., Chermanne, B., Vandenhaute, M., Longdoz, B., Yernaux, M., and Laitat, E.: Long term carbon dioxide exchange above a mixed forest in the Belgian Ardennes, Agric. Forest Meteorol., 108, 293–315, 2001. a
Aubinet, M., Moureaux, C., Bodson, B., Dufranne, D., Heinesch, B., Suleau, M., Vancutsem, F., and Vilret, A.: Carbon sequestration by a crop over a 4-year sugar beet/winter wheat/seed potato/winter wheat rotation cycle, Agric. Forest Meteorol., 149, 407–418, 2009. a
Baldocchi, D.: Assesing the eddy covariance technique for evaluating carbon dioxide exchange rates of ecosystems: past, present and future, Glob. Change Biol., 9, 479–492, 2003. a
Béziat, P., Ceschia, E., and Dedieu, G.: Carbon balance of a three crop succession over two cropland sites in South West France, Agric. Forest Meteorol., 149, 1628–1645, 2009. a
Brooks, P. D., Geilmann, H., Werner, R. A., and Brand, W. A.: Improved precision of coupled δ13C and δ15N measurements from single samples using an elemental analyzer/isotope ratio mass spectrometer combination with a post-column six-port valve and selective CO2 trapping; improved halide robustness of the combustion reactor using CeO2, Rapid Communications in Mass Spectrometry, 17, 1924–1926, 2003. a
Brunner, A., Ammann, C., Neftel, A., and Spirig, C.: Methanol exchange between grassland and the atmosphere, Biogeosciences, 4, 395–410, https://doi.org/10.5194/bg-4-395-2007, 2007. a
Buysse, P., Bodson, B., Debacq, A., De Ligne, A., Heinesch, B., Manise, T., Moureaux, C., and Aubinet, M.: Carbon budget measurement over 12 years at a crop production site in the silty-loam region in Belgium, Agric. Forest Meteorol., 246, 241–255, 2017. a, b, c, d
Ceschia, E., Beziat, P., Dejoux, J. F., and Aubinet, M.: Management effects on net ecosystem carbon and GHG budgets at European crop sites, Agriculture, 139, 363–383, 2010. a, b, c, d, e, f, g, h, i
Chenu, C., Angers, D. A., Barré, P., Derrien, D., Arrouays, D., and Balesdent, J.: Increasing organic stocks in agricultural soils: Knowledge gaps and potential innovations, Soil Till. Res., https://doi.org/10.1016/j.still.2018.04.011, 2018. a
Chi, J., Waldo, S., Pressley, S., O'Keeffe, P., Huggins, D., Stöckle, C., Pan, W. L., Brooks, E., and Lamb, B.: Assessing carbon and water dynamics of no-till and conventional tillage cropping systems in the inland Pacific Northwest US using the eddy covariance method, Agric. Forest Meteorol., 218–219, 37–49, 2016. a
Ciais, P., Wattenbach, M., Vuichard, N., Smith, P., Piao, S. L., DON, A., Luyssaert, S., Janssens, I. A., BONDEAU, A., DECHOW, R., LEIP, A., SMITH, P. C., Beer, C., van der WERF, G. R., GERVOIS, S., van OOST, K., Tomelleri, E., Freibauer, A., Schulze, E. D., and CarboeErope Synthesis Team: The European carbon balance. Part 2: Croplands, Glob. Change Biol., 16, 1409–1428, 2010. a
Ciais, P., Sabine, C., Bala, G., Bopp, L., Brovkin, V., Canadell, J., Chhabra, A., DeFries, R., Galloway, J., Heimann, M., Jones, C., Le Quéré, C., Myneni, R. B., Piao, S., and Thornton, P.: Carbon and Other Biogeochemical Cycles, in: Climate Change 2013: The Physical Science Basis, edited by: Stocker, T. F., Qin, D., Plattner, G. K., Tignor, M., Allen, S. K., Boschung, J., Nauels, A., Xia, Y., Bex, V., Midgley, P. M., Contribution of Working Group I to the Fifth Assessment Report of the Intergovernmental Panel on Climate Change, 2013. a
Dold, C., Büyükcangaz, H., Rondinelli, W., Prueger, J. H., Sauer, T. J., and Hatfield, J. L.: Long-term carbon uptake of agro-ecosystems in the Midwest, Agric. Forest Meteorol., 232, 128–140, 2017. a
Etzold, S., Buchmann, N., and Eugster, W.: Contribution of advection to the carbon budget measured by eddy covariance at a steep mountain slope forest in Switzerland, Biogeosciences, 7, 2461–2475, https://doi.org/10.5194/bg-7-2461-2010, 2010. a
Eugster, W. and Merbold, L.: Eddy covariance for quantifying trace gas fluxes from soils, Soil, 1, 187–205, https://doi.org/10.5194/soil-1-187-2015, 2015. a
Eugster, W., Moffat, A. M., Ceschia, E., Aubinet, M., Ammann, C., Osborne, B., Davis, P. A., Smith, P., Jacobs, C., Moors, E., Le Dantec, V., Béziat, P., Saunders, M., Jans, W., Grünwald, T., Rebmann, C., Kutsch, W. L., Czerný, R., Janouš, D., Moureaux, C., Dufranne, D., Carrara, A., Magliulo, V., Di Tommasi, P., Olesen, J. E., Schelde, K., Olioso, A., Bernhofer, C., Cellier, P., Larmanou, E., Loubet, B., Wattenbach, M., Marloie, O., Sanz, M. J., Søgaard, H., and Buchmann, N.: Management effects on European cropland respiration, Agric. Ecosyst. Environ., 139, 346–362, 2010. a, b, c
Gilmanov, T. G., Soussana, J. F., Aires, L., and Allard, V.: Partitioning European grassland net ecosystem CO2 exchange into gross primary productivity and ecosystem respiration using light response function analysis, Agriculture, 121, 93–120, 2007. a
Gilmanov, T. G., Wylie, B. K., Tieszen, L. L., Meyers, T. P., Baron, V. S., Bernacchi, C. J., Billesbach, D. P., Burba, G. G., Fischer, M. L., Glenn, A. J., Hanan, N. P., Hatfield, J. L., Heuer, M. W., Hollinger, S. E., Howard, D. M., Matamala, R., Prueger, J. H., Tenuta, M., and Young, D. G.: CO2 uptake and ecophysiological parameters of the grain crops of midcontinent North America: Estimates from flux tower measurements, Agric. Ecosyst. Environ., 164, 162–175, 2013. a
Gilmanov, T. G., Baker, J. M., Bernacchi, C. J., Billesbach, D. P., Burba, G. G., Castro, S., Chen, J., Eugster, W., Fischer, M. L., Gamon, J. A., Gebremedhin, M. T., Glenn, A. J., Griffis, T. J., Hatfield, J. L., Heuer, M. W., Howard, D. M., Leclerc, M. Y., Loescher, H. W., Marloie, O., Meyers, T. P., Olioso, A., Phillips, R. L., Prueger, J. H., Skinner, R. H., Suyker, A. E., Tenuta, M., and Wylie, B. K.: Productivity and carbon dioxide exchange of leguminous crops: estimates from flux tower measurements, Agron. J., 106, 545–559, 2014. a
Hollinger, S. E., Bernacchi, C. J., and Meyers, T. P.: Carbon budget of mature no-till ecosystem in North Central Region of the United States, Agric. Forest Meteorol., 130, 59–69, 2005. a
Horst, T. W.: A simple formula for attenuation of eddy fluxes measured with first-order-response scalar sensors, Bound.-Lay. Meteorol., 82, 219–233, 1997. a
Janssens, I. A., Freibauer, A., Ciais, P., Smith, P., Nabuurs, G.-J., Folberth, G., Schlamadinger, B., Hutjes, R. W. A., Ceulemans, R., Schulze, E.-D., Valentini, R., and Dolman, A. J.: Europe's terrestrial biosphere absorbs 7 to 12 % of European anthropogenic CO2 emissions, Science, 300, 1538–1542, https://doi.org/10.1126/science.1083592, 2003. a, b
Janzen, H. H.: The soil carbon dilemma: Shall we hoard it or use it?, Soil Biol. Biochem., 38, 419–424, 2006. a
Jensen, R., Herbst, M., and Friborg, T.: Direct and indirect controls of the interannual variability in atmospheric CO2 exchange of three contrasting ecosystems in Denmark, Agric. Forest Meteorol., 233, 12–31, 2017. a
Joo, E., Hussain, M. Z., Zeri, M., Masters, M. D., Miller, J. N., Gomez-Casanovas, N., DeLucia, E. H., and Bernacchi, C. J.: The influence of drought and heat stress on long-term carbon fluxes of bioenergy crops grown in the Midwestern USA, Plant, Cell Environ., 39, 1928–1940, https://doi.org/10.1111/pce.12751, 2016. a
Kutsch, W. L., Aubinet, M., Buchmann, N., Smith, P., Osborne, B., Eugster, W., Wattenbach, M., Schrumpf, M., Schulze, E. D., Tomelleri, E., Ceschia, E., Bernhofer, C., Beziat, P., Carrara, A., Di Tommasi, P., Grünwald, T., Jones, M., Magliulo, V., Marloie, O., Moureaux, C., Olioso, A., Sanz, M. J., Saunders, M., Søgaard, H., and Ziegler, W.: The net biome production of full crop rotations in Europe, Agric. Ecosyst. Environ., 139, 336–345, 2010. a, b
Lal, R., Delgado, J. A., Groffman, P. M., Millar, N., Dell, C., and Rotz, A.: Management to mitigate and adapt to climate change, J. Soil Water Conserv., 66, 276–285, 2011. a
Landwirtschaftliche Beratungszentrale Lindau LBL: Wirz Handbuch Pflanzen und Tiere, Verlag Wirz, Lindau, Switzerland, 2005. a, b, c
Leifeld, J., Reiser, R., and Oberholzer, H.-R.: Consequences of Conventional versus Organic farming on Soil Carbon: Results from a 27-Year Field Experiment, Agron. J., 101, 1204–1218, doi:10.2134/agronj2009.0002, 2009. a
Li, Y.-L., Tenhunen, J., Owen, K., Schmitt, M., Bahn, M., Droesler, M., Otieno, D., Schmidt, M., Gruenwald, T., Hussain, M. Z., Mirzae, H., and Bernhofer, C.: Patterns in CO2 gas exchange capacity of grassland ecosystems in the Alps, Agric. Forest Meteorol., 148, 51–68, 2008. a
Maltas, A., Kebli, H., Oberholzer, H.-R., Weisskopf, P., and Sinaj, S.: The effects of organic and mineral fertilizers on carbon sequestration, soil properties, and crop yields from a long-term field experiment under a Swiss conventional farming system, Land Degrad. Dev., 29, 926–938, 2018. a, b
Moncrieff, J., Clement, R., Finnigan, J., and Meyers, T.: Averaging, detrending, and filtering of eddy covariance time series, in: Handbook of micrometeorology, 7–31, Springer, 2004. a
Moureaux, C., Debacq, A., Bodson, B., Heinesch, B., and Aubinet, M.: Annual net ecosystem carbon exchange by a sugar beet crop, Agric. Forest Meteorol., 139, 25–39, 2006. a
Moureaux, C., Debacq, A., Hoyaux, J., Suleau, M., Tourneur, D., Vancutsem, F., Bodson, B., and Aubinet, M.: Carbon balance assessment of a Belgian winter wheat crop (Triticum aestivum L.), Glob. Change Biol., 14, 1353–1366, 2008. a
Nakai, T., van der Molen, M. K., Gash, J. H. C., and Kodama, Y.: Correction of sonic anemometer angle of attack errors, Agric. Forest Meteorol., 136, 19–30, 2006. a
NDC: Switzerland's intended nationally determined contribution (INDC) and clarifying information, Submitted to the UNFCCC on 06 October 2017, http://www4.unfccc.int/ndcregistry/PublishedDocuments/Switzerland First/15 02 27_INDC Contribution of Switzerland.pdf, last access: 20 April 2018, 2017. a
Nishimura, S., Yonemura, S., Sawamoto, T., Shirato, Y., Akiyama, H., Sudo, S., and Yagi, K.: Effect of land use change from paddy rice cultivation to upland crop cultivation on soil carbon budget of a cropland in Japan, Agric. Ecosyst. Environ., 125, 9–20, 2008. a, b
Oberholzer, H.-R., Leifeld, J., and Mayer, J.: Changes in soil carbon and crop yield over 60 years in the Zurich Organic Fertilization Experiment, following land-use change from grassland to cropland, J. Plant Nutr. Soil Sci., 177, 696–704, 2014. a
Parazoo, N. C., Bowman, K., and Fisher, J. B.: Terrestrial gross primary production inferred from satellite fluorescence and vegetation models, Glob. Change Biol., 20, 3103–3121, 2014. a
Powlson, D. S., Stirling, C. M., Thierfelder, C., White, R. P., and Jat, M. L.: Does conservation agriculture deliver climate change mitigation through soil carbon sequestration in tropical agro-ecosystems?, Agric. Ecosyst. Environ., 220, 164–174, 2016. a
Prescher, A.-K., Grünwald, T., and Bernhofer, C.: Land use regulates carbon budgets in eastern Germany: From NEE to NBP, Agric. Forest Meteor., 150, 1016–1025, 2010. a, b
Reichstein, M., Falge, E., Baldocchi, D. et al.: On the separation of net ecosystem exchange into assimilation and ecosystem respiration: review and improved algorithm, Glob. Change Biol., 11, 1424–1439, 2005. a
Reichstein, M., Moffat, A. M., Wutzler, T. W., and Sickel, K. S.: ReddyProc: Data processing and plotting utilities of (half-)hourly eddy-covariance measurements, https://cran.r-project.org/web/packages/REddyProc/index.html (last access: 28 August 2018), R package version 1.0.0/r18, 2017. a
Robertson, G. P., Paul, E. A., and Harwood, R. R.: Greenhouse Gases in Intensive Agriculture: Contributions of Individual Gases to the Radiative Forcing of the Atmosphere, Science, 289, 1922–1925, https://doi.org/10.1126/science.289.5486.1922, 2000. a
Rogiers, N., Eugster, W., Furger, M., and Siegwolf, R.: Effect of land management on ecosystem carbon fluxes at a subalpine grassland site in the Swiss Alps, Theor. Appl. Climatol., 80, 187–203, 2004. a
Schmidt, M., Reichenau, T., Fiener, P., and Schneider, K.: The carbon budget of a winter wheat field: An eddy covariance analysis of seasonal and inter-annual variability, Agric. Forest Meteorol., 165, 114–126, https://doi.org/10.1016/j.agrformet.2012.05.012, 2012. a
Schulze, E. D., Luyssaert, S., Ciais, P., Freibauer, A., Janssens et al, I. A., Soussana, J. F., Smith, P., Grace, J., Levin, I., Thiruchittampalam, B., Heimann, M., Dolman, A. J., Valentini, R., Bousquet, P., Peylin, P., Peters, W., Rödenbeck, C., Etiope, G., Vuichard, N., Wattenbach, M., Nabuurs, G. J., Poussi, Z., Nieschulze, J., and Gash, J. H.: Importance of methane and nitrous oxide for Europe's terrestrial greenhouse-gas balance, Nat. Geosci., 2, 842–850, https://doi.org/10.1038/ngeo686, 2009. a, b
Smith, P., Cotrufo, M. F., Rumpel, C., Paustian, K., Kuikman, P. J., Elliott, J. A., McDowell, R., Griffiths, R. I., Asakawa, S., Bustamante, M., House, J. I., Sobocká, J., Harper, R., Pan, G., West, P. C., Gerber, J. S., Clark, J. M., Adhya, T., Scholes, R. J., and Scholes, M. C.: Biogeochemical cycles and biodiversity as key drivers of ecosystem services provided by soils, Soil, 1, 665–685, 2015. a
Soussana, J. F., Allard, V., Pilegaard, K., Ambus, P., Amman, C., Campbell, C., Ceschia, E., Clifton-Brown, J., Czobel, S., Domingues, R., Flechard, C., Fuhrer, J., Hensen, A., Horvath, L., Jones, M., Kasper, G., Martin, C., Nagy, Z., Neftel, A., Raschi, A., Baronti, S., Rees, R. M., Skiba, U., Stefani, P., Manca, G., Sutton, M., Tuba, Z., and Valentini, R.: Full accounting of the greenhouse gas (CO2, N2O, CH4) budget of nine European grassland sites, Agric. Ecosyst. Environ., 121, 121–134, 2007. a
Sus, O., Williams, M., Bernhofer, C., Beziat, P., Buchmann, N., Ceschia, E., Doherty, R., Eugster, W., Grünwald, T., Kutsch, W., Smith, P., and Wattenbach, M.: A linked carbon cycle and crop developmental model: Description and evaluation against measurements of carbon fluxes and carbon stocks at several European agricultural sites, Agric. Ecosyst. Environ.,, 139, 402–418, 2010. a
Suyker, A. E. and Verma, S. B.: Gross primary production and ecosystem respiration of irrigated and rainfed maize–soybean cropping systems over 8 years, Agric. Forest Meteorol., 165, 12–24, 2012. a
Swiss Federal Council: Verordnung über die Direktzahlungen an die Landwirtschaft (Direktzahlungsverordnung, DZV) vom 23. Oktober 2013 (Stand am 26. September 2017) (Swiss council regulation no. 910.13: Ordinance on Direct Payments of 23 October 2013 (as of 26 September 2017), https://www.admin.ch/opc/de/classified-compilation/20130216/201709260000/910.13.pdf (last access: 28 August 2018), 152 pp, 2017. a
The World Bank: https://data.worldbank.org/indicator/AG.LND.AGRI.ZS, (last access: 19 December 2017), 2017. a
Turner, D. P., Koerper, G. J., Harmon, M. E., and Lee, J. J.: A carbon budget for forests of the conterminous United States, Ecol. Appl., 5, 421–436, 1995. a
Vickers, D. and Mahrt, L.: Quality control and flux sampling problems for tower and aircraft data, J. Atmos. Ocean. Tech., 14, 512–526, 1997. a
Vuichard, N., Ciais, P., Viovy, N., Li, L., Ceschia, E., Wattenbach, M., Bernacchi, C., Emmel, C., Grünwald, T., Jans, W., Loubet, B., and Wu, X.: Simulating the net ecosystem CO2 exchange and its components over winter wheat cultivation sites across a large climate gradient in Europe using the ORCHIDEE-STICS generic model, Agriculture, 226, 1–17, 2016. a
Walter, H. and Lieth, H.: Klimadiagramm-Weltatlas, Gustav Fischer Verlag, Jena, 1960–1967. a
Webb, E., Pearman, G., and Leuning, R.: Correction of flux measurements for density effects due to heat and water-vapor transfer, Q. J. Roy. Meteor. Soc., 106, 85–100, 1980. a
Werner, R. A. and Brand, W. A.: Referencing strategies and techniques in stable isotope ratio analysis, Rapid Commun. Mass Sp., 15, 501–519, 2001. a
Werner, R. A., Bruch, B. A., and Brand, W. A.: ConFlo III-an interface for high precision δ13C and δ15N analysis with an extended dynamic range, Rapid Commun. Mass Sp., 13, 1237–1241, 1999. a
Wilczak, J. M., Oncley, S. P., and Stage, S. A.: Sonic anemometer tilt correction algorithms, Bound.-Lay. Meteorol., 99, 127–150, 2001. a
Zielis, S., Etzold, S., Zweifel, R., Eugster, W., Haeni, M., and Buchmann, N.: NEP of a Swiss subalpine forest is significantly driven not only by current but also by previous year's weather, Biogeosciences, 11, 1627–1635, https://doi.org/10.5194/bg-11-1627-2014, 2014. a
- Abstract
- Introduction
- Material and methods
- Results and discussion
- Conclusions
- Data availability
- Appendix A: Uncertainty estimation of NBP calculated with Eq. (1)
- Appendix B: Carbon budget tables
- Appendix C: Soil carbon and nitrogen
- NEEcum and NBPcum with seasons defined by ploughing
- Appendix E: Fertiliser inputs
- Author contributions
- Competing interests
- Acknowledgements
- References