In response to the growing concerns over the spread of the coronavirus and travel restrictions, in-person attendance for the EGU General Assembly 2020 in Vienna has been cancelled. The conference is instead being transformed into a virtual event, where attendees can remotely share their research by uploading presentation material online.
Let’s be honest: digital alternatives don’t replicate the in-person meetings. We are all familiar with the standard social mixers at conferences – coffee breaks, icebreaker parties and dinners with colleagues – and when going online, it is easy to lose touch with the attendee experience. On top of that, many people have concerns about sharing their work online and wonder whether the pros outweigh the cons. To read more about why you should participate in the online conference, check out this complementary blog post here. Some advantages of online conferencing are the increase of accessibility and inclusion by reducing barriers to participation, as well as reducing travel and carbon emissions.
But can we give a killer talk or present a poster efficiently even at an online conference? The answer is YES, of course! In this blog, we discuss how you can use different tools and formats to make your conference presentation suitable for the online experience. And don’t forget that the EGU assigned everyone a ‘display’, meaning that you don’t have to stick with your original poster- or oral presentation assignment. Let’s use this opportunity to get creative and find the format that works best for you!
Don’t be shy and present your work with a video
Sharing your research in a way that the audience understands it is just as important as conducting the research itself. And delivering your presentation or poster in the form of a silent file definitely makes it more challenging. So, why don’t you video-record yourself instead? Even though there is a file size limit of 50MB, you could still create a short (< 5 min) video in which you present your work. After all, the human brain is better at interpreting visuals than textual content. If you include yourself in a video, you can better engage with the viewers and deliver your take home messages more efficiently. The thought of investing more time into filming yourself may sound frivolous or even too self-promotional. However, not only you make sure that your findings are better understood and reach more people, but ultimately you have the chance to evaluate your own presenting skills and find out what can be improved.
There are plenty of good (and free) resources that you can use to make a nice video of you presenting your poster or slides. Loom – a screencasting tool with a very user-friendly interface – is definitely one of them. Once installed, you can capture yourself in the camera bubble across any application (Power Point, Keynote, etc). The free basic plan includes all the necessary features to obtain a nice quality video and a trimming option that you can use after finishing your recording, so that the viewer doesn’t see the first few moments while you were setting up. And regarding the file size, we did a brief check for you: a 5-minute video on Loom (with default quality settings) has a size of about 40 MB. Another great option for delivering your research with a video is Zoom. You just need to start a meeting (with yourself, a bit weird but that’s how it works), share the screen with your presentation or poster, click on the record button and then you are good to go. Unlike Loom, Zoom does not allow you to trim your recording to remove unnecessary parts. For more help and support, Google and YouTube are your best friends.

An example of how your video-recorded presentation would look like using Loom (right) or Zoom (left). Credit: Silvia Brizzi.
If we have managed to convince you to record yourself, think ahead about the design of the slides/poster, if you include yourself in the video. You certainly don’t want your camera bubble to cover your title, or part of your figures. Consider that the audio quality is really important for a good video, so use a microphone if you have one. Don’t worry too much about the camera. Self-recording may feel a little weird at first, but being confident in front of a camera just takes practice. Posture and body language are important. Don’t be afraid to use hand gestures, but find a good balance because too many gestures can be distracting as well. Last but not least, think about lighting, as it can have a big impact on the video quality. And remember that your video doesn’t have to be perfect to be good.
Break it down and make it visual
If recording yourself is not your thing, don’t worry. There are other ways to efficiently present your research online. It might be tempting to simply upload a slightly modified version of your A0 poster that you presented at a previous conference, but be careful with this! It would most likely contain way too much information, and because of the large size, it will be very challenging for people to navigate through the poster efficiently. Instead, you could think of creating a small poster, presentation slide or simply one key figure. As the cliché goes, a figure is worth a thousand words, so if it is well designed, it can give your readers all they need to get the main message of your research.
If you prefer to stay close to the original scientific poster format, you might want to consider scaling it down to an A3 or A4 size, so that it can easily be read from a screen. This automatically means it will hold much less information than your original poster, forcing you to break it down to the key points of your work. A new type of scientific posters, #betterposter, has been proposed to do exactly this. It contains the main message of a study, in plain language, with just a bit of additional information on the sides. If you quickly scan through many posters like this, you will still be able to get the main idea; something that is impossible with more traditional scientific posters. This #betterposter format could therefore serve as an inspiration for your small digital poster.
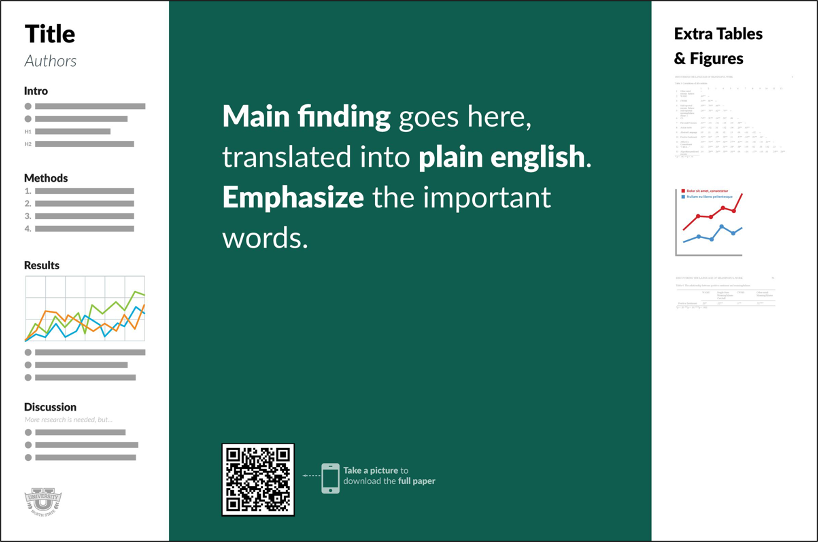
The #betterposter template as proposed by Mike Morrison.
Another way to visually present your work is by using a Graphical Abstract, an increasingly popular way to communicate science. Think of it as a single self-explanatory figure that visualizes a process or clearly presents one key point. In this way, you can help the reader to better understand the content of your research, even though you are not there to present it in person. It may take some time to make a good graphical abstract, but they are a perfect eye-catcher and can be pretty effective. Plus, they are recyclable. Once you have it, you can include it into a powerpoint, conference poster, as a final figure in your paper, or even on social media. For inspiration, check out the templates of this Mind the Graph tool, that helps you design graphical abstracts, scientific illustrations, but also posters and presentation slides.
Even though #shareEGU20 is a pilot experiment that may raise new challenges and questions, it is also an exciting opportunity to stimulate scientific discussions during this period of unprecedented isolation. We look forward to seeing how, online!