Expeditions in the Southern Ocean are invaluable opportunities to learn more about this fascinating but remote region of the world. However, sending vessels to navigate the hostile Antarctic waters is an expensive endeavor, not only financially but also from a human perspective. When vessels are forced to turn back due to hazardous conditions or, even worse, become stuck in the ice (as shown in our Image of the Week), a mission full of expectations can quickly turn into a nightmare. Hence there is an increasing demand for reliable information on the navigability of the Southern Ocean a few weeks to a few months in advance. This information could support the final decision whether to start the journey or not, and would allow minimizing the associated risks.
What’s the problem?
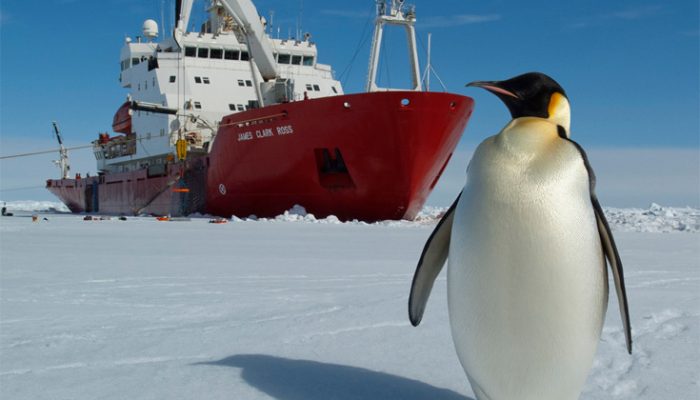
In late February 2018, the British vessel RRS James Clark Ross was heading to the Eastern Antarctic Peninsula to investigate the consequences of the calving of a massive iceberg from the Larsen C ice shelf. Unfortunately the vessel had to turn back before reaching its goal due to the unexpected presence of thick sea ice in the region. This story is not unusual. During Christmas 2013, a Russian ship named the Akademik Shokalskiy also got stuck in several meters of Antarctic sea ice. Ironically, one of the rescuing vessels itself (the Chinese Xuě Lóng) got trapped in the ice as well. To prevent such events from happening again, we need to be able to predict the upcoming sea-ice conditions. Can sea-ice conditions be forecast at seasonal time scales? If so, how?
Antarctic sea ice, the Year of Polar Prediction and SIPN South
To prevent accidents and unforeseen problems, one goal of the Year Of Polar Prediction is to enhance environmental forecasting capabilities from operational (hours to days) to tactical (weeks to months) time scales in high latitude regions. Several studies support the notion that Antarctic sea ice may be predictable a few months ahead, at least in certain regions (Holland et al. 2017, Chen and Yuan 2004, Holland et al. 2013, Marchi et al. 2018).
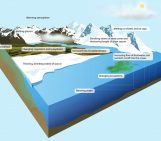
![]() To investigate further the predictability of Antarctic sea ice, the Sea Ice Prediction Network South (SIPN South) was launched in 2017. It is a two-year international project endorsed by the YOPP. SIPN South pursues three strategic objectives:
To investigate further the predictability of Antarctic sea ice, the Sea Ice Prediction Network South (SIPN South) was launched in 2017. It is a two-year international project endorsed by the YOPP. SIPN South pursues three strategic objectives:
- Hosting seasonal outlooks of Antarctic sea ice to better understand the sources of sea-ice predictability and the origins of systematic forecast errors in different types of models.
- Providing news and information on the current state of Antarctic sea ice, disseminating research to a wider audience and reporting ongoing field campaigns.
- Coordinating realistic seasonal prediction exercises to investigate the potential use of this information for users and customers, primarily ships navigating in the region.
February 2018 seasonal sea-ice forecasts
As a first major milestone, SIPN South provided coordinated forecasts of sea ice for February 2018. February is the month with the smallest sea-ice area in the Antarctic, and therefore most of the shipping traffic in the region happens around that time. Participants were asked to provide an estimation of sea-ice coverage (area, concentration) for each day of February 2018, and were asked to issue their predictions by mid-December 2017. 13 research groups participated in this first forecasting experiment, following different approaches: several groups used fully coupled climate dynamical models, while others applied statistical regression methods to predict future ice conditions.
As we all know, the weather is unpredictable beyond a few days. However, previous research has suggested that the statistics of weather (its mean, its variability) can potentially be predicted from months to decades, due to the coupling of the atmosphere with “slower” components of the climate system like the ocean. To reflect this and to accurately estimate the statistics of weather, groups tend to provide not just one forecast, but several of them. These “ensembles” of forecasts provided by each group therefore represent all possible states of the atmosphere, ocean and ice that may prevail in February 2018 – given the known initial conditions of December.
The results of the coordinated experiment are shown in Figure 2. The February mean sea-ice area is shown for each group (colors), along with two actual observational references (black). Bear in mind that the forecast data were issued two months before the actual target date! Here, the forecasts are expressed as anomalies with respect to a reference climatology. All forecasts tend to overestimate the February sea ice area in the Ross Sea. A reason for this wrong estimation might be a very unusual cyclone, which passed over the Ross Sea around the 20th of January 2018 (i.e., between the time the forecasts were issued and the period for verification). This cyclone brought relatively warm air into the region. Furthermore it fractured the ice, opening more areas of open water and possibly increasing the effect of the ice-albedo feedback. Events like this one are not individually predictable several weeks in advance, but a well-designed forecasting system should at least account for this possibility. Despite running ensembles of forecasts, the sea-ice reduction in the Ross Sea was not captured by most forecasts. This may point towards a common and systematic deficiency in these prediction systems.
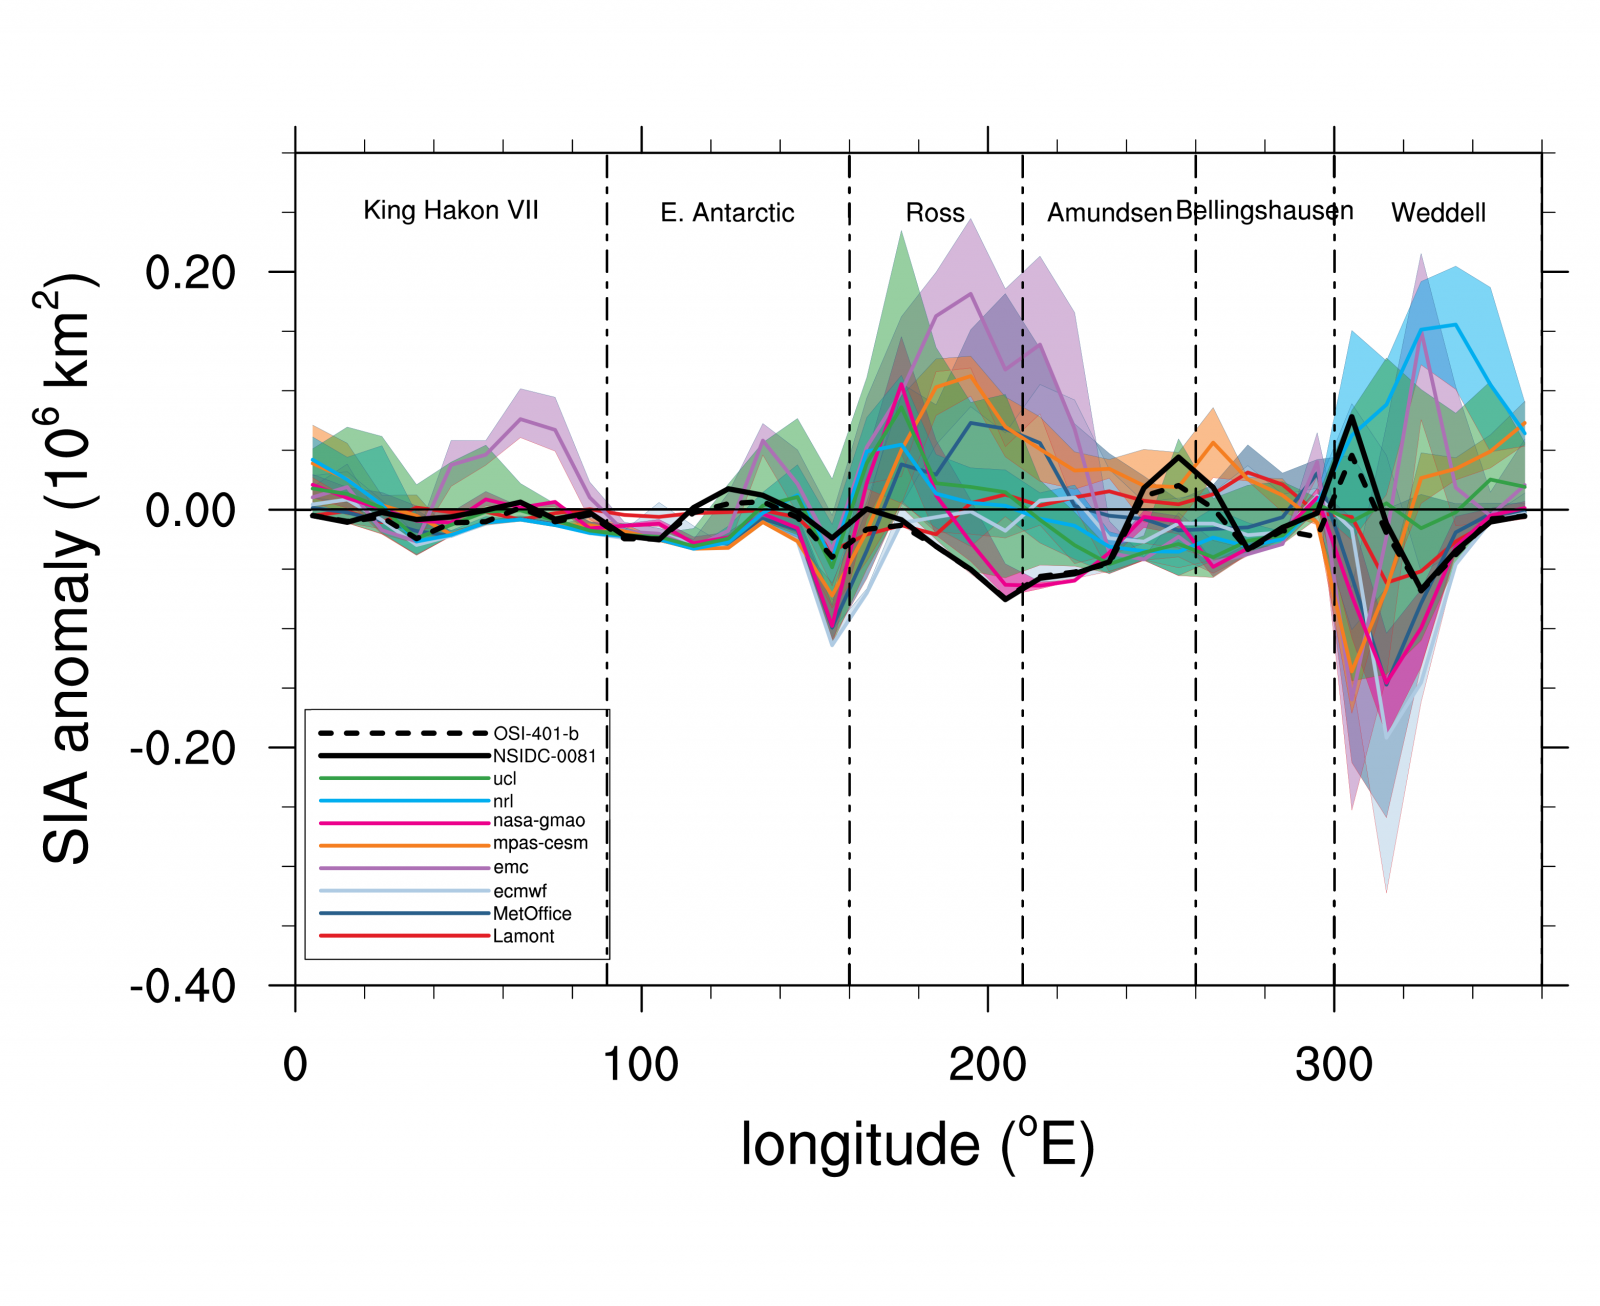
Figure 2: February 2018 mean regional sea-ice area anomaly (compared to 1979-2014 observed climatology) by longitude, for the 13 submissions, with observed estimates given in black. Solid lines show the ensemble mean for each contribution, with transparent shading indicating the ensemble range (min-max) [Credit: F. Massonnet].
Communicating climate information
Sea-ice area, as shown in Fig. 2, is a primary parameter used by scientists to quantify ice presence in a given region. It is also a useful number to diagnose model-data mismatch. However, sea-ice area is of little use for those who actually need climate information. For someone operating a vessel, the important information is how likely that vessel is to encounter sea ice in a given region for a given day in February. Information from Fig. 2, while certainly useful to scientists, is meaningless to those willing to extract practical information for navigation.
Alongside the work to understand fundamental drivers of sea-ice predictability in order to eventually improve the predictions, it is necessary to consider how potential users will interact with the forecasts. As explained above, climate forecasts are probabilistic in nature. Communicating probabilistic information to a non-trained audience is always a challenging task: for example, how would you interpret a forecast saying that there is a 50% chance of rain for tomorrow?
To reflect the irreducible uncertainty of climate forecasts (see previous section), sea-ice forecasts are generally expressed in terms of sea-ice probability, i.e. the probability that a given region of the Southern Ocean has sea-ice concentration larger than 15%. This probability is derived for each day and each grid cell from the ensemble forecasts contributed by each group (Fig. 3). If well calibrated, this type of information can be useful to those planning operations weeks in advance. For example, all but one model had forecast a high (>80%) probability of ice presence in the Larsen C area (eastern tip of the Antarctic Peninsula) where the RRS James Clark Ross got stuck five months ago. That is, there was a high risk, according to those forecasts, that ice would be present in that area in February. Of course, this does not mean that navigation would have been impossible (ice breakers can still operate in icy waters, provided the ice is thin), but these forecasts provided a first-order warning that there was a significant risk of encountering hazardous ice conditions there.
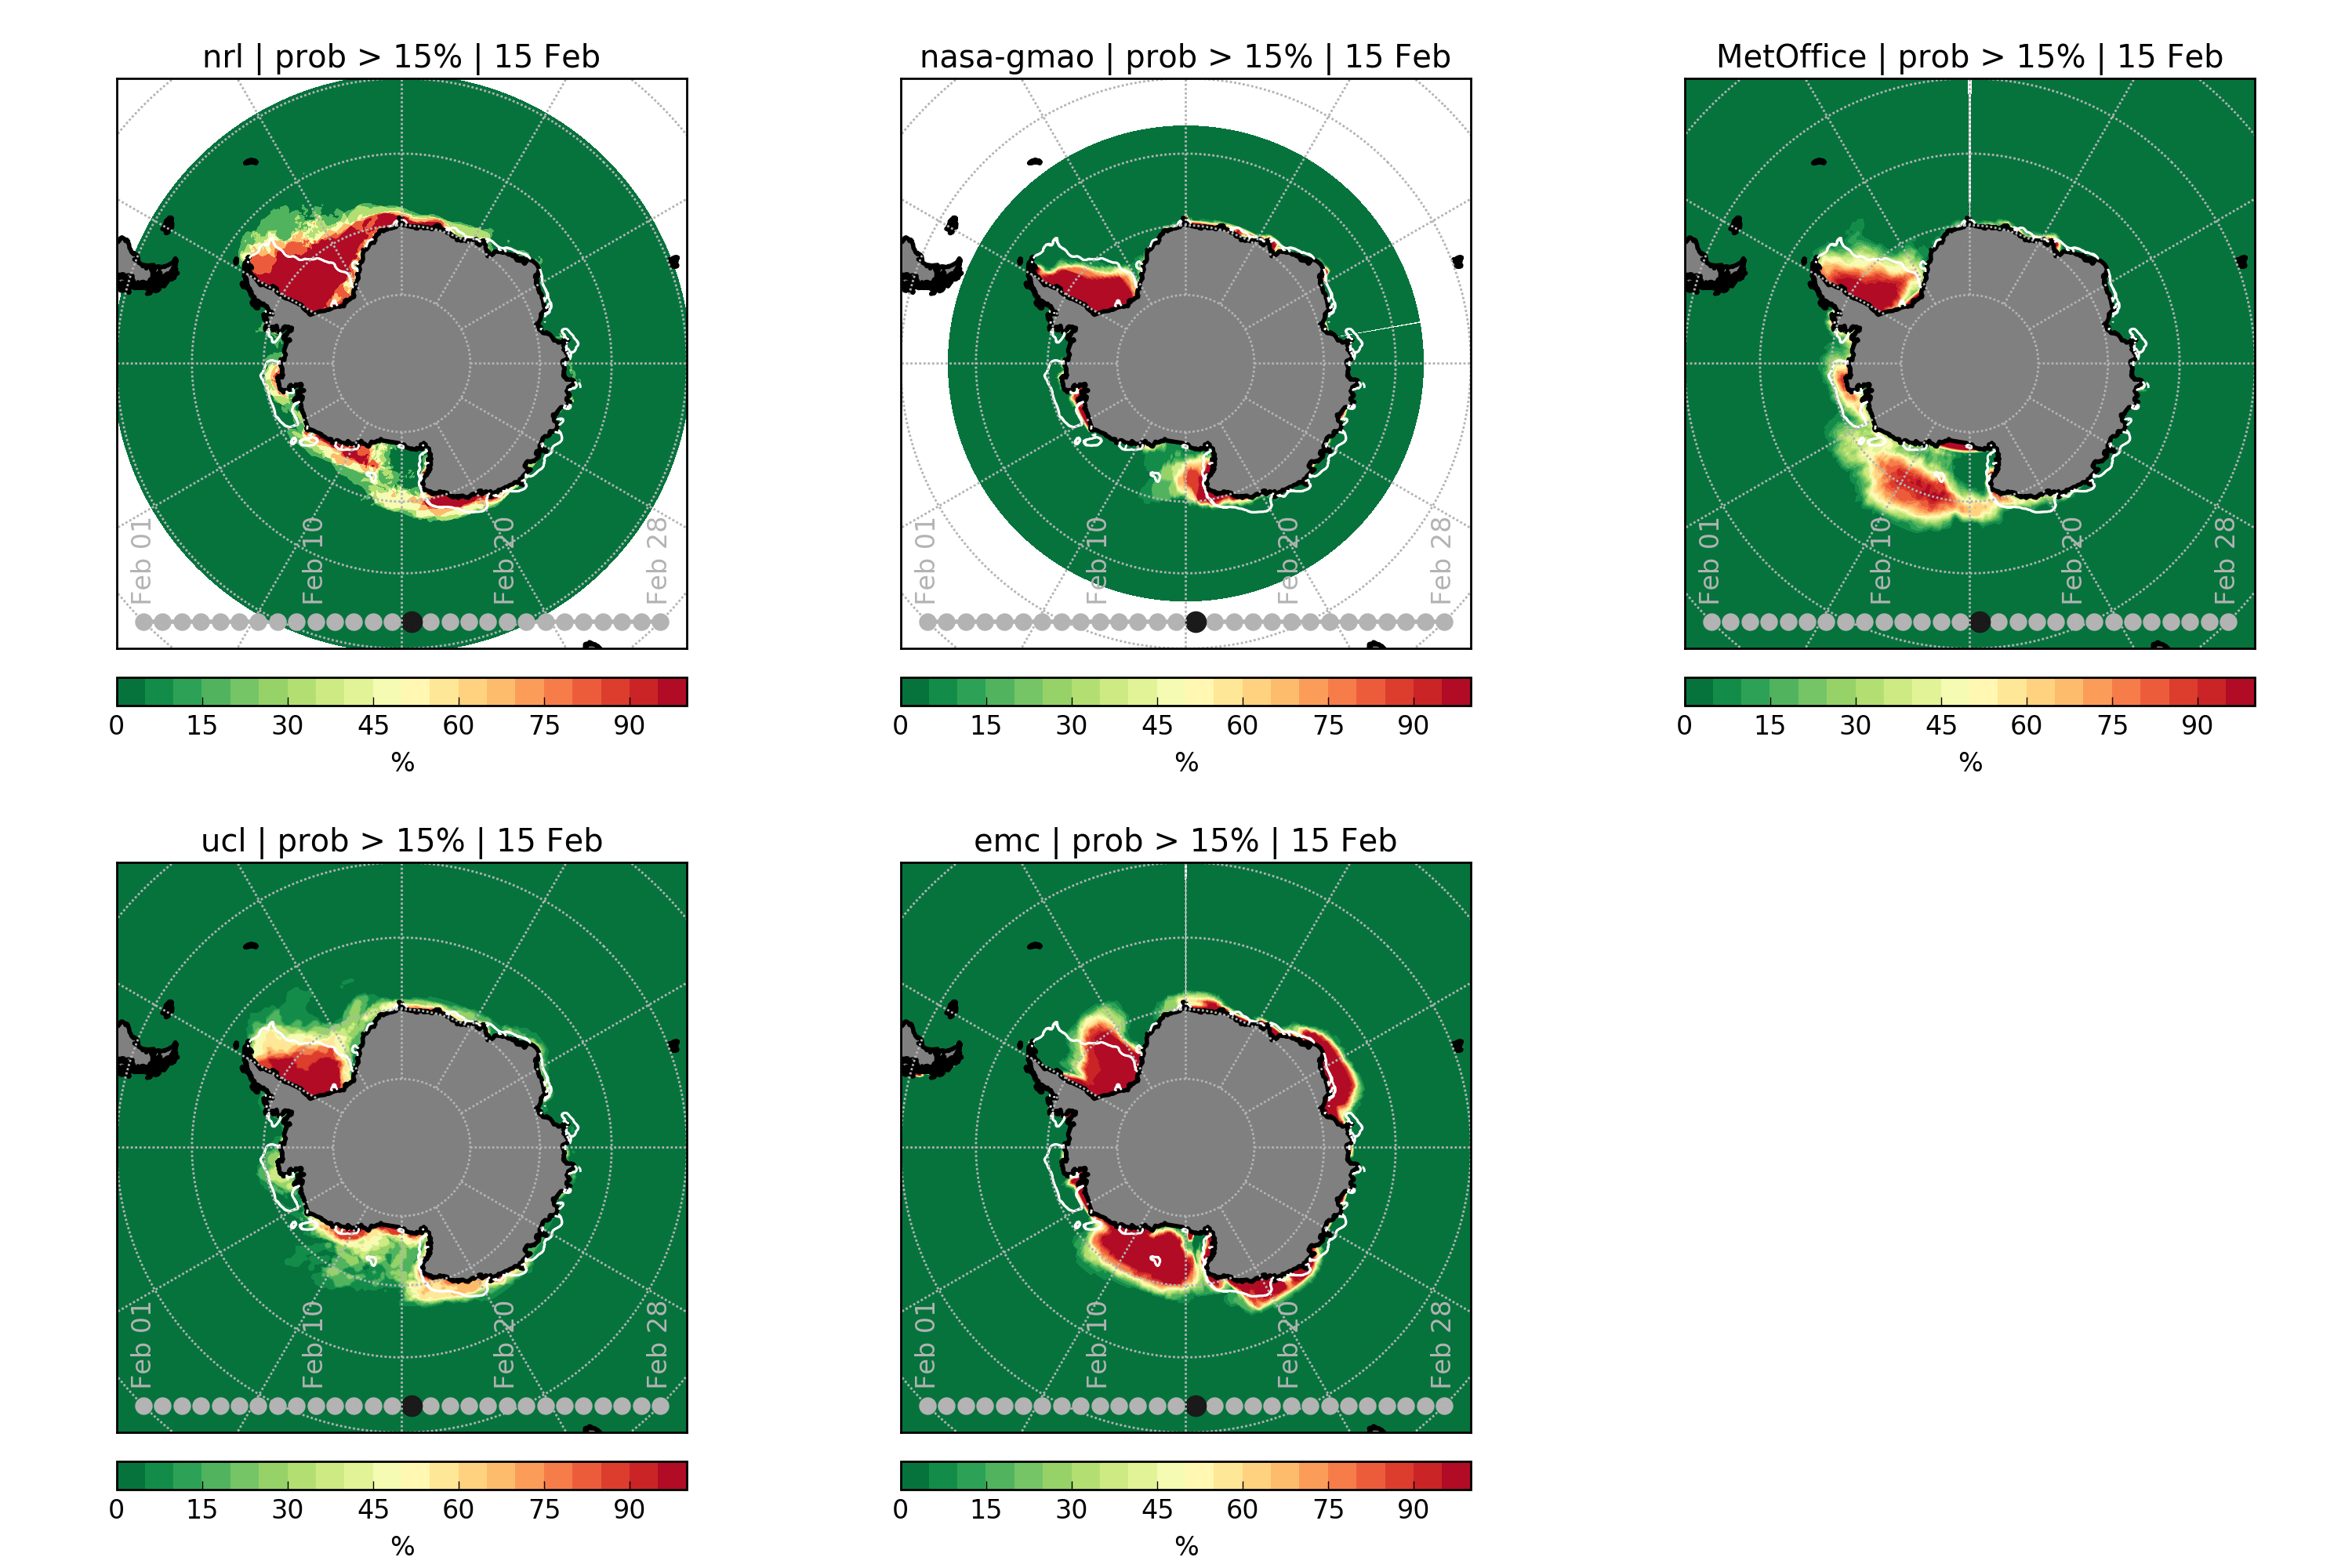
Figure 3: Probability of sea-ice presence for 15th February 2018, as forecasted by the five groups that submitted daily sea-ice concentration information. The sea-ice edge as observed by two products is shown in white. The probability of presence for a given day corresponds to the fraction of ensemble members that simulate sea-ice concentration larger than 15% in a given grid cell for that day. A dynamic animation of the figure showing all 28 days of February is available on the SIPN South website. [Credit: F. Massonnet]
Forecasting February 2019
The core phase of the Year of Polar Prediction entails “Special Observing Periods”, that is, intensive efforts to monitor the Arctic and Antarctic regions but also to enhance modeling activities (see this previous post). The (unique) Special Observing Period in the Southern Ocean will take place between mid-November 2018 and mid-February 2019. A new call for contributions will be launched by SIPN South to collect sea-ice forecasts for austral summer 2019, hoping that the first exercise in 2018 will raise the interest of even more research groups. A key question will be to assess whether the systems will be able to forecast better the sea-ice conditions in the challenging Ross Sea area, where most forecasts failed. Better insights will hopefully be gained in tracing the origin of systematic model error and lead to an improvement of Antarctic sea ice predictions within the next decade. As reliable climate information is crucially needed in this remote but important region of the world, future efforts to predict Antarctic sea ice will be very welcome!
Further reading
- Holland, M. M., Landrum, L., Raphael, M., & Stammerjohn, S. (2017). Springtime winds drive Ross Sea ice variability and change in the following autumn. Nature Communications, 8(1). doi: 10.1038/s41467-017-00820-0
- Chen, D., and Yuan, X. (2004). A Markov Model for Seasonal Forecast of Antarctic Sea Ice. Journal of Climate, 17(16), 3156–3168. doi: 10.1175/1520-0442(2004)017%3C3156:ammfsf%3E2.0.co;2
- Holland, M. M., Blanchard-Wrigglesworth, E., Kay, J., & Vavrus, S. (2013). Initial-value predictability of Antarctic sea ice in the Community Climate System Model 3. Geophysical Research Letters, 40(10), 2121–2124. doi: 10.1002/grl.50410
- Marchi, S., Fichefet, T., Goosse, H., Zunz, V., Tietsche, S., Day, J. J., & Hawkins, E. (2018). Reemergence of Antarctic sea ice predictability and its link to deep ocean mixing in global climate models. Climate Dynamics. doi: 10.1007/s00382-018-4292-2
- Massonnet, F. (2015). Commentary: Communicating climate complexity. Physics Today 68, 9, 8. doi: 10.1063/PT.3.2894
- Image of the Week – The warming effect of the decline of Arctic Sea Ice
- Image of the Week – Climate feedbacks demystified in polar regions
- Image of the Week – Understanding Antarctic Sea Ice Expansion
Edited by Adam Bateson and Clara Burgard
 François Massonnet is a F.R.S.-FNRS Post-Doctoral Researcher at the Université catholique de Louvain and scientific collaborator at the Barcelona Supercomputing Center (Spain). He is assessing climate models as tools to understand (retrospectively and prospectively) polar climate variability and beyond. He tweets as @FMassonnet. Contact Email: francois.massonnet@uclouvain.be