
Polar surface water, circumpolar deep water, dense shelf water, North Atlantic deep water, Antarctic bottom water… These names pop in most discussions about the ice-ocean interaction and how this will change in a warming climate, but what do they refer to?
In our second “For Dummies” article, we shall give you a brief introduction to the concept of “water mass”, explain how to differentiate water from more water, and why you would even need to do so.
Global heat budget and the need for an ocean circulation
The global climate is driven by differences between the incoming shortwave radiation and the outgoing longwave radiation (Fig. 1):
- In the tropics, there is a surplus of energy: the Sun brings more heat, all year-round, than what is radiated out;
- At the poles in contrast, there is a net deficit: more energy is leaving than is coming from the Sun (who is absent in winter).
The global ocean and atmosphere circulations act to reduce this imbalance, by transporting the excess heat from the tropics to the pole. Here we will focus on the global ocean circulation only, since this post is written by an oceanographer, but similar principles also apply to atmospheric circulation.

Fig 1 :Earth’s latitudinal radiation bugdet, The tropics show a surplus of energy that compensates the Poles’ deficit [Credit: National Oceanograpy Center].
The global ocean circulation
In a nutshell, surface waters bring heat towards the poles where they cool down, sink to the abyss, and return towards the tropics as deep waters where they can go back to the surface..…
We talk about “the global ocean circulation” because although the Earth officially has five oceans, they are not totally separate bodies of water. In fact, the Arctic, Atlantic, Indian, Pacific and Southern oceans are interconnected, with water circulating and moving between them. How does this happen?
The global ocean circulation has two components:
- The wind-driven circulation, fast but limited to a few hundred metres below the surface of the ocean (read more about it here for example);
- And the thermohaline circulation (shown on Fig. 2), slower but which affects the whole depth of the ocean.
Today’s post focuses on the latter, since we will talk about water properties. The thermohaline circulation, also called density-driven circulation, depends on two water properties:
- The temperature (‘thermo’) is mostly controlled by heat exchange with the atmosphere or the ice. Cold water has a high density.
- The salinity (‘haline’) can be modified by evaporation, precipitation, or addition of fresh water from melted glaciers/ice sheets or rivers. Salty water has a high density.
![Fig 2- The global thermohaline circulation shows warm surface currents in red, cold deep currents in blue. Deep waters form in the North Atlantic and Southern oceans. [Credit: NASA]](https://blogs.egu.eu/divisions/cr/files/2016/09/Thermohaline_Circulation_2.jpg)
Fig 2- The global thermohaline circulation shows warm surface currents in red, cold deep currents in blue. Deep waters form in the North Atlantic and Southern oceans [Credit: NASA].
Roughly speaking, a water mass is any drop of the ocean within a specific range of temperature and salinity, and hence specific density. Some water masses are found at particular locations or seasons, while others can be found all around the globe, all the time. Since density sets the depth (density MUST always increase with depth), water masses will lie and travel at particular depth levels.
A quick and dirty oceanography guide
Water masses are formed.
Some are the result of the mixing of other water masses. The others start at the water surface, where they exchange gas (notably oxygen and carbon) with the atmosphere. When a water mass becomes denser than the waters below it , for example, if it is cooled by the wind or ice, it sinks to its corresponding depth within the ocean.

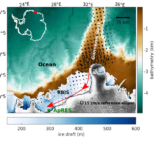
Fig 3- The bathymetry of the Arctic Ocean forces dense (deep) water masses to enter the region via Fram Strait whereas lighter (shallower) waters can go through the Barents Sea [Credit: adapted from IBCAO bathymetry map, Jakobsson et al., 2012 ].
Water masses move all around the globe…
…provided their density allows it. The vertical distribution of density in the ocean must be “stably stratified”, which means that the density increases with depth. In practice, that means that dense waters cannot climb up a shallow bathymetric feature but have to find a way around it. For example to enter the Arctic Ocean (Fig 3), a dense water mass has no choice but to go via Fram Strait, whereas a less dense one can go via the Barents Trough. Similarly, there is a depth limit of about 500 m to reach the northwestern Greenland glaciers.
Water masses retain their properties
Or rather, not all these properties change considerably with space and time. We are not talking only about temperature and salinity, but also about gas and chemical concentrations. It is then possible to track a water mass as it travels around the globe or watch its evolution with time.
You should use T-S diagrams
Visualising water properties can either be done with one graph showing how the temperature varies with depth plus another one for the salinity (multiplied by the number of locations to be observed at the same time); or all of this information can be combined on one image (as done on Fig. 4). This image is called a T-S diagram it and shows how the temperature (T) varies as a function of the salinity (S). It is customary to also draw the lines of constant density (the ‘isopycnals’, black on Fig. 3). These isopycnals give information about the types of mixing happening and the stratification, but we will talk about that in another post.
![Fig 4 - an example of how to combine several profiles (top) into a T-S diagram, for one of the randomly selected Arctic historical points that I work with.[Credit: C. Heuzé]](https://blogs.egu.eu/divisions/cr/files/2016/09/figures.jpg)
Fig 4 – an example of how to combine several profiles (top) into a T-S diagram, for one of the randomly selected Arctic historical points that I work with [Credit: C. Heuzé].
Because each water mass occupies a very specific region of the T-S diagram (see Fig 5 for an example in the Atlantic), identifying them is relatively easy once you have plotted your data on such diagrams.
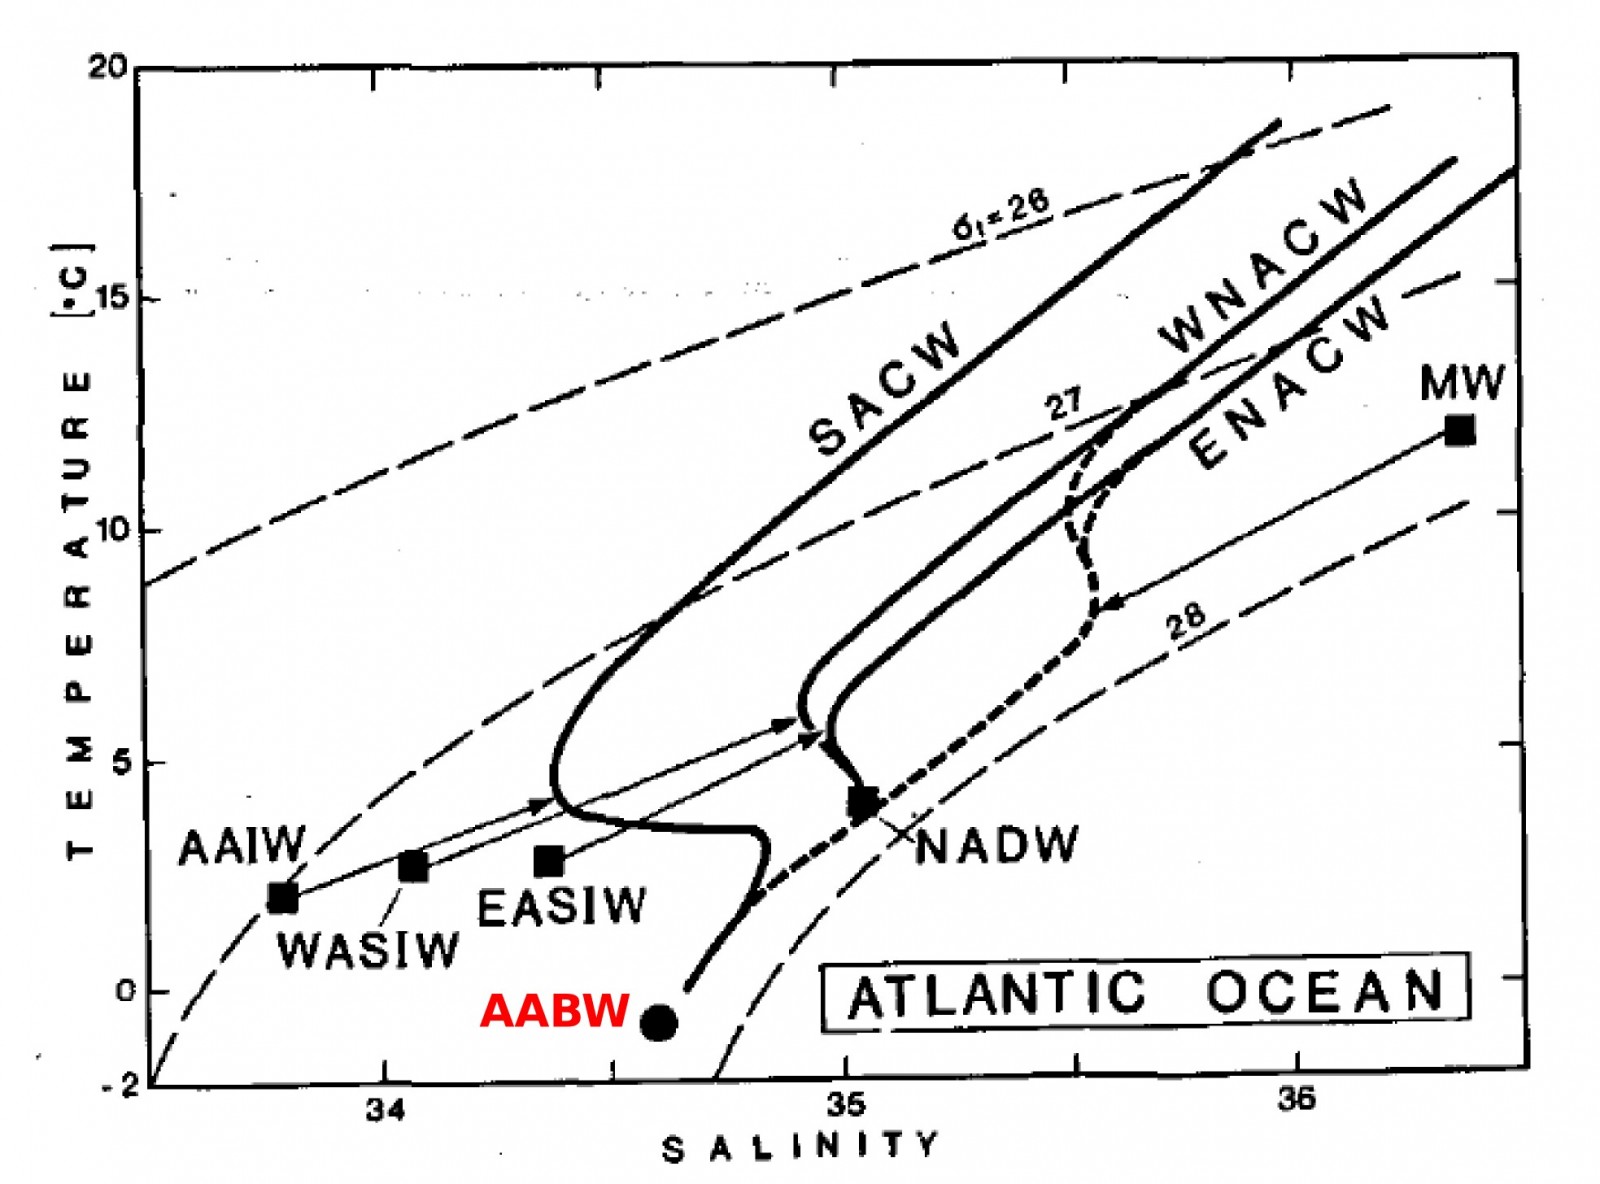
Fig 5 – example of a reference T-S diagram with the different water masses of the Atlantic Ocean. Water massed are labelled by their acronym (e.g. AABW= Antarctic Bottom Water) [Credit: after Emery and Meincke (1986)]
Why do ocean water masses matter to the cryosphere?
- Marine ice sheet instability, and more generally basal melting, is caused by warm dense waters melting floating glaciers from below; how dense the water mass is determines whether it can even reach the glacier.
- Sea ice formation and melting can be largely affected by water masses moving up and down, especially is those going up are warm.
But there’s a reason why we always talk about “ice-ocean” interactions: it’s not just the ocean acting on the ice, but also the ice impacting the ocean:
- The densest water mass in the world, Antarctic Bottom Water, forms in the middle of winter if a hole in the sea-ice cover opens (that is called a polynya), suddenly exposing the relatively warm ocean to the extremely cold atmosphere. The resulting strong heat loss and the increased salinity as sea ice reforms make this water sink straight to the bottom;
- On the other hand, deep water formation can be stopped by the cryosphere: paleorecord evidence showed that it happened in the North Atlantic due to surging ice sheet / marine ice sheet instability (so called Heinrich events) or meltwater floods (Younger Dryas);
- Less dramatically, icebergs, ice shelves or even sea ice, can cool or freshen water masses they meet, forming “modified” water masses (for example “modified Atlantic Water”),
Each aspect of these interactions is already experiencing climate change and is much more complex than this brief overview… but that will be the topic of another post!
Further reading
- Rahmstorf, S., 2006: Thermohaline Ocean Circulation. In: Encyclopedia of Quaternary Sciences, Edited by S. A. Elias. Elsevier, Amsterdam. Munk, W. H. (1950). On the wind-driven ocean circulation. Journal of Meteorology, 7(2), 80-93.
- Ocean Circulation by E. Brown, A. Colling, D. Park, J. Phillips, D. Rothery and J. Wright, ISBN: 978-0-7506-5278-0
- Killworth, P.D. (1983) Deep convection in the world ocean. Reviews of Geophysics, 21(1), 1-26.
- Nicholls, K.W. et al (2009) Ice-ocean processes over the continental shelf of the southern Weddell Sea, Antarctica: A review. Reviews of Geophysics, 47(3).
- Emery, W. J., & Meincke, J. (1986). Global water masses-summary and review. Oceanologica Acta, 9(4), 383-391.
Edited by Sophie Berger and Emma Smith

Pingback: Cryospheric Sciences | Image of the Week – What an ice hole!
Pingback: Cryospheric Sciences | How small changes can make a big difference: tipping points in Antarctica
Pingback: Ocean Sciences | The fragile connection of the Ocean and the Cryosphere – a story from the past
Pingback: Cryospheric Sciences | For Dummies: How Arctic sea ice and the AMOC interact
Pingback: Cryospheric Sciences | The fragile connection of the Ocean and the Cryosphere – a story from the past