Picture this: you are on your commute home, smartphone or tablet in hand, surfing the internet. You might quickly catch up on the latest news, check in with your friend’s on Facebook, or take to Twitter to share a morsel of information with your followers.
This scenario is common in the modern era of technology. No doubt we are all guilty of indulging in a serious session of internet navigation every now and then (and nothing wrong with that!). But what if your online persona could also make a contribution to better natural disaster management?
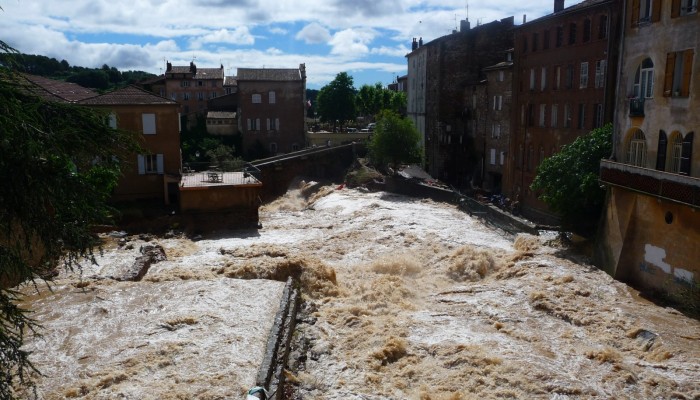
One of the many challenges during, and in the immediate aftermath of, natural disasters is being able to provide local populations with timely and reliable information about the extent of damage and/or disruption expected. Flooding events are a prime example: minimising and managing the financial, human and emotional cost of floods is key for researchers, local communities, policy makers and authorities alike.
Contributing to this effort, a team of German researchers have designed a tool which harnesses our desire to share snippets of our lives via social media to support the creation of rapid inundation maps during flooding events. The research was recently published in the EGU open access journal, Natural Hazards and Earth System Sciences.
Currently, measurements of flood water heights made by river gauges, hydrodynamic-numerical models and remote sensing data – such as before and after images acquired by satellites – are used to create rapid response flood maps. Despite their successful and wide-spread use, they are not without limitations. River gauges only allow for narrow point information on water heights during a flood and require detailed topographical data to be validated. Hydronamic-numerical models aren’t very flexible: it is difficult to build unforeseen incidents into them (e.g. a dike breach). Remote sensing techniques have limitations when it comes to providing real time information; it can take up to 48 hours for the images to be delivered and processed before they can be used.
The study authors argue that eyewitness information about flooding events shared via social media can fill in some of the gaps. Using quantitative data, such as geographical location and flood water height, held in images shared via Twitter and Flickr, can provide information to make more detailed and accurate flood maps in almost real-time. The researchers put the theory to the test for the June 2013 Dresden floods.
The city of Dresden, with its 800,000 inhabitants, sits on the banks of the River Elbe, known for its long history of flooding. This means the city’s population is more aware of the hazard and, being an urban area, likely has a large number of social media users, making it a good case study candidate.

Location of useful photos retrieved with PostDistiller and inundation depths estimates. (Photos by Denny Tumlirsch (@Flitz-patrick), @ubahnverleih, Sven Wernicke (@SvenWernicke) and Leo Käßner (@leokaesner). For instance, photos 1 and 2 show inundated roads but a dry sidewalk. This context en- ables the analyst to estimate inundation depth in the order of approximately 5 cm Taken from J. Fohringer et al. (2016))
The research team created an inundation map using only information from photos filtered from Twitter and Flickr. To collate the flood data from social media, the team designed a computer programme. In the first instance a search for key words (in both English and German) related to floods was ran: “Hochwasser”, “Flut”, “Flood”, “inundation”, to name a few. The results were then filtered by the time frame of interest (from May 5th to 21st June 2013) as well as the geolocation of the posts. This yielded a total of 84 posts from which five inundation depths were derived (see the figure caption for details of how the team achieved this), in the space of no more than four hours. The depths calculated were then used to create the inundation map.
To test the robustness of the map, the team created a second map relying only on online data acquired from the Dresden river gauge. Comparing the two maps shows that the social media created map overestimates inundation height by decimetres as well as the geographical extent of the flooding. Despite that, the study authors argue that the errors are acceptable when it comes to providing rapid inundation maps, particularly in situations when no other information is available.
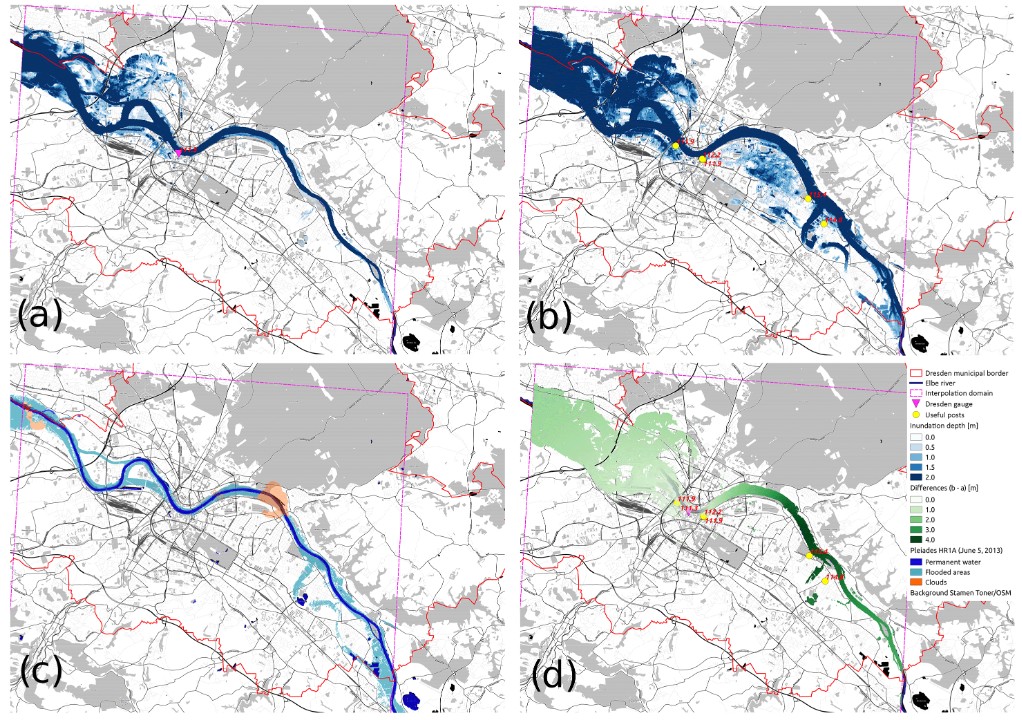
Inundation maps and inundation depths derived from online water level observations (a) and social media content (b); inundated area derived from the reference remote sensing flood footprint (c); and differences between inundation depths for overlapping areas in scenarios (a) and (b) (panel d). J. Fohringer et al. (2016))
The case study also highlighted some of the method’s shortcomings. It will be important to improve the vertical and horizontal accuracy of the social media created maps by supplementing them with more detailed topographical terrain data. The current method of acquiring data via social media is relatively passive and relies on users sharing images from a flooding event. Crowdsourcing data, where citizens are actively encouraged to share images, would improve the reliability of the data as well as the spatial coverage.
So when you next take a selfie or capture a stunning landscape to share on social media, who knows, the data held in your images and geolocation could have even more value than you might have originally thought!
By Laura Roberts Artal, EGU Communications Officer
References
Fohringer, J., Dransch, D., Kreibich, H., and Schröter, K.: Social media as an information source for rapid flood inundation mapping, Nat. Hazards Earth Syst. Sci., 15, 2725-2738, doi:10.5194/nhess-15-2725-2015, 2015.
Rimkus, S. et al. A Century of UK Flood Losses (conference abstract) Geophysical Research Abstracts Vol. 18, EGU2016-11905, 2016, EGU General Assembly 2016
Trejo Rangel, M.A., et al. How Can Flood Affect the Real Estate Market? (conference abstract) Geophysical Research Abstracts, Vol. 18, EGU2016-8977, 2016, EGU General Assembly 2016

Tracy G. Taylor
What an innovative approach to disaster management! Leveraging social media data for rapid inundation maps is a brilliant idea. While there are some limitations, the potential for real-time information and improved accuracy is promising. Keep up the great work in advancing disaster response strategies through technology and community participation!