Mapping Earth’s most remote continent presents a number of unique challenges. Antarctic cartographers and scientists are using some of the most advanced mapping technologies available to get a clearer picture of the continent. We asked Brad Herried, a Cartographer and Web Developer at the Polar Geospatial Center at the University of Minnesota, a few questions about what it’s like to do this unique job both on and off the ice.
Before we go too much further… what is the Polar Geospatial Center, and what does it do for polar science and scientists?
The Polar Geospatial Center (PGC), founded in 2007 by Director Paul Morin, is a research group of about 20 staff and students at the University of Minnesota with a simple mission: solve geospatial problems at the poles (Antarctica and the Arctic). Because we are funded (primarily) through the U.S. National Science Foundation (NSF) and NASA Cryospheric Sciences, that is the community we support – other U.S.-funded polar researchers. We provide custom maps, high-resolution commercial satellite imagery, and Geographic Information System (GIS) support for researchers who would like to use the data for their research but may not have the expertise to do so.
Our primary service is providing high-resolution satellite imagery (i.e. from the DigitalGlobe, Inc. constellation) to U.S.-funded polar researchers – at no additional cost to their grants – through licensing agreements with the U.S. Government. It has proven beneficial to researchers to have a service so that we do the hard parts of data management, remote sensing, and automation of satellite imagery processing so that they don’t have to. So, a glaciologist or geomorphologist or wildlife ecologist studying at the poles may come to us and say: I would like to use satellite imagery to study phenomenon x or y. Some groups use it just for logistics (these are some of the least mapped places on Earth after all) to get to their site. Some groups’ entire research is done using remote sensing.
What kinds of data and resources do you use?
The PGC’s polar archive of high-resolution commercial imagery is absolutely astounding (like, in the thousands of terabytes). The imagery, although licensed to us by U.S. Government contracts, is collected by the DigitalGlobe, Inc. constellation of satellites (e.g. WorldView-2), much like the imagery where you can see your house/car in Google Earth. The benefit is that we can provide it at no cost to our users (researchers). That resource, along with the expertise of the staff at PGC, can provide solutions to users, whether it’s making a simple map of a remote research site or providing a time-series of satellite imagery for a researcher studying change detection (like, say for a glacier front in Greenland).
This also presents a challenge. How do we manage and effectively deliver that much data? We have relied on skilled staff, ingenuity, cheap storage, high-performance computing, and automation to become successful.
As the saying goes, automate or die.
What’s your role at the PGC? How did you find your way into a job like this?
I started at the PGC as a graduate student in 2008. I knew nothing about Antarctica or the Arctic, but my background and studies in GIS & cartography offered a wide range of jobs. After I graduated, I became a full-time employee as the lead cartographer of the (at the time, very small) group. Currently, I do a lot more GIS web application development and geospatial data management. We have recognized the need for more automated, “self-service” systems for our users to get the data they need in a timely manner, and less of asking a PGC employee for a custom product. As the saying goes, automate or die. But, of course, I still spend a fair bit of my times creating maps to keep my cartographic juices going.
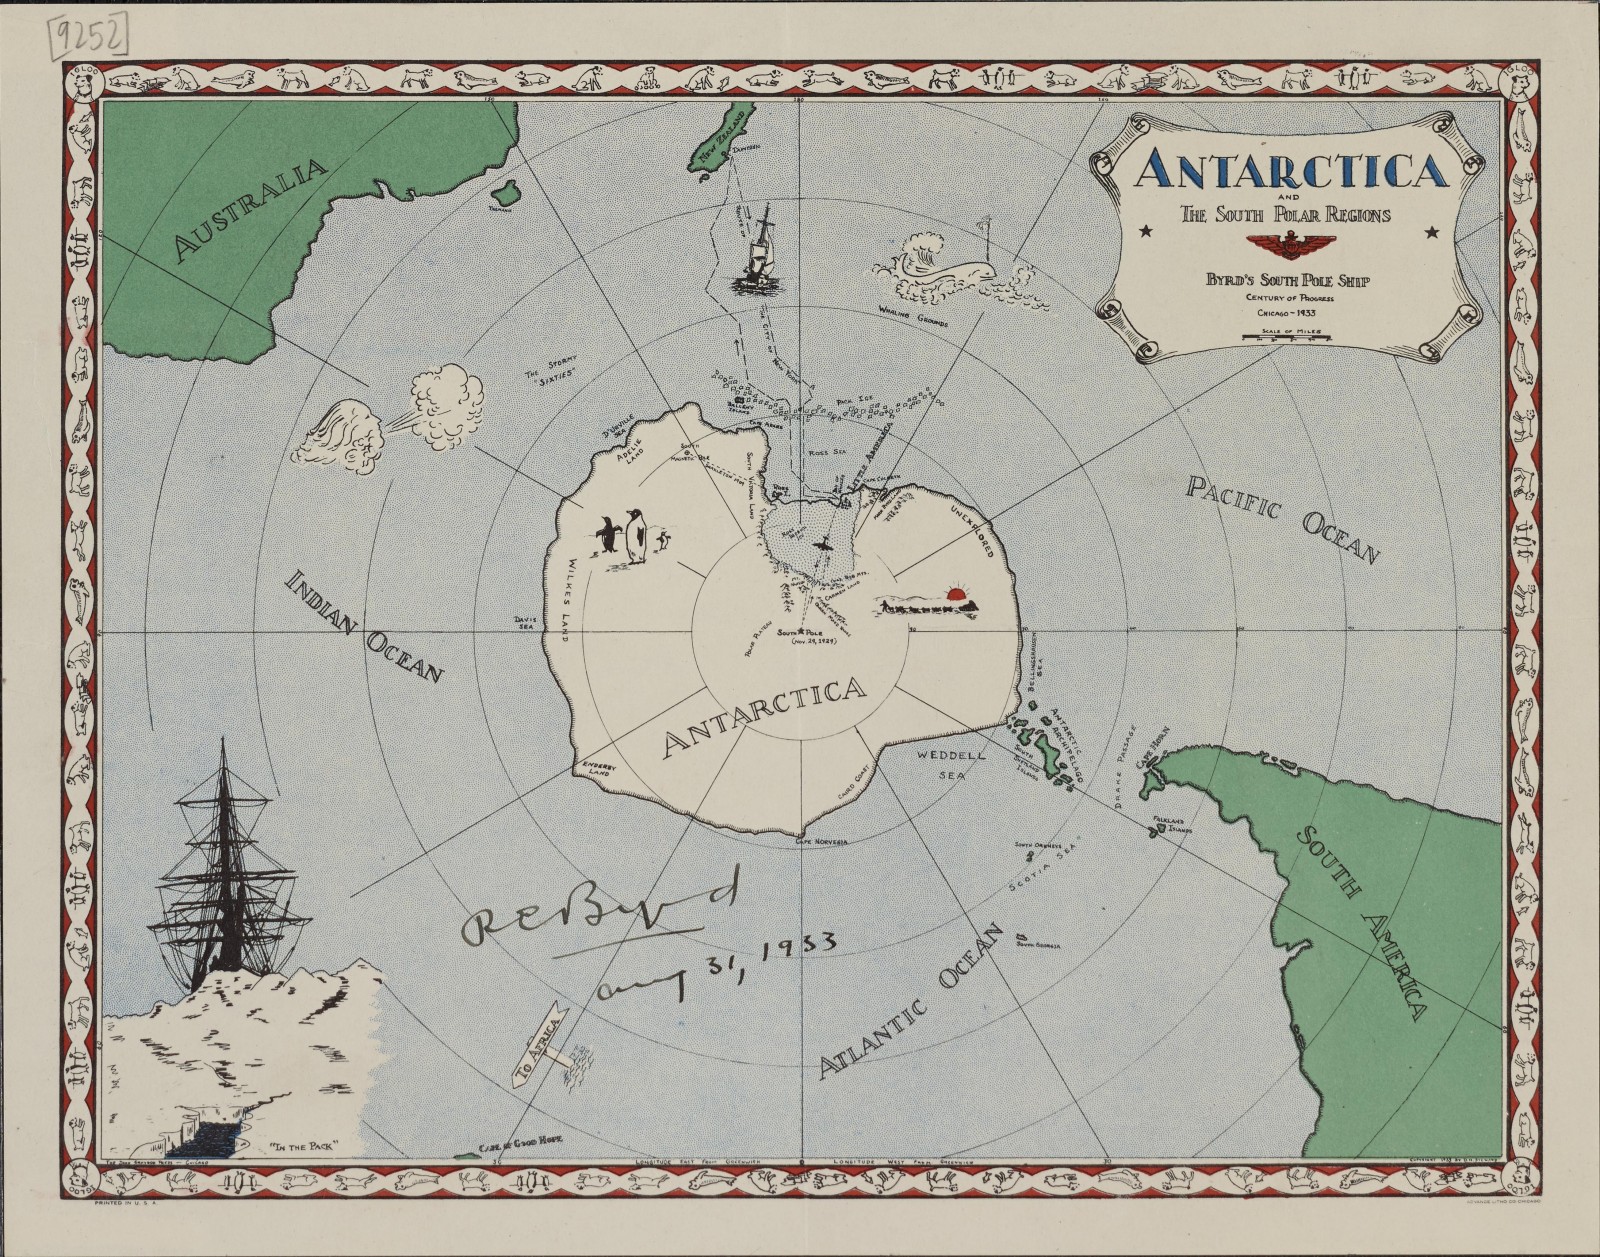
Antarctica and the South Polar Regions. Map from the American explorer Richard Byrd’s second expedition in 1933. [Credit: Byrd Antarctic Expeditions]
What kind of work do PGC employees do in Antarctica?
The PGC staffs an office at the United States’ McMurdo Station annually from October to February, with 3-5 staff rotating throughout the field season. It is really an extension of our responsibilities, with a couple interesting twists, both good and bad. First, a majority of our users (NSF-funded researchers) come through McMurdo Station in preparation for their fieldwork. It’s a beneficial and unique experience to meet with them one-on-one and solve problems, ironically, faster than email exchanges back in the States. Second – and this is true of all of Antarctica – the internet bandwidth is very limited. So, we have to a) prepare more regarding what data/imagery we have on site and b) do more with less. That always proves to be a fun challenge because it is impossible to access our entire archive of imagery from down there.
How could I forget collecting Google Street View in Antarctica.
There have been several years, however, when we do get to go out into the field! In past years, we have conducted various field campaigns in the nearby McMurdo Dry Valleys to collect survey ground control to make our satellite imagery more accurate. And, how could I forget collecting Google Street View (with some custom builds of the typical car-camera system for snowmobiles, heavy-duty trucks, and backpacks). The Google Street View provides a window into the world of Antarctica – history, facilities, science, and of course its beautiful landscapes – to a wide audience who only dream of visiting Antarctica.
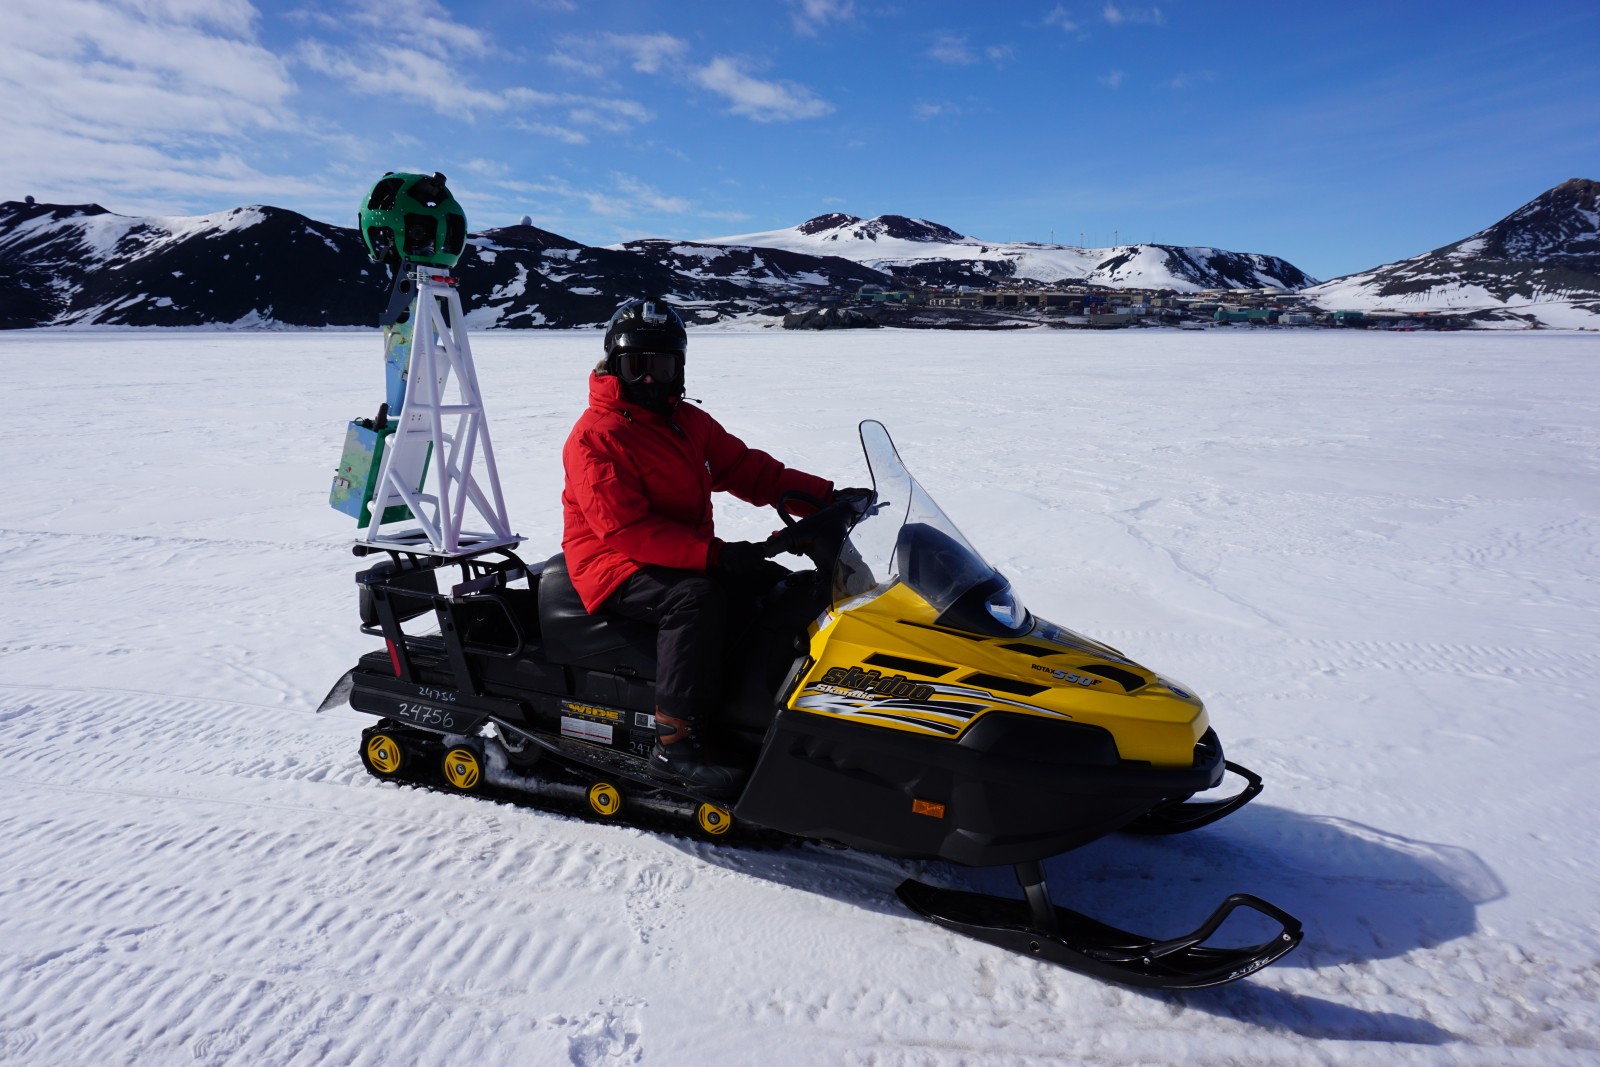
Brad on a snowmobile collecting Google Street View imagery [Credit: Brad Herried]
What are some of the interesting projects PGC has worked on? What’s exciting at PGC right now?
The PGC does a lot to contribute to polar mapping. There’s not exactly a ton of geospatial data or maps for the polar regions, especially Antarctica. What data or maps there are, it is not often of very high quality. For example, there are regions of Antarctica (especially in inland East Antarctica) which have not been properly mapped or surveyed since the 1960s. Those maps offer little help if you’re trying to land an aircraft in the area. So, PGC has done a lot to improve that geospatial data including creating more accurate coastlines, improving geographic coordinates of named features (sometimes the location can be off by 10s of kilometers!), organizing historic aerial photography, and digitizing map collections. These are important to have, but it all changes when you can collect data 100 times more accurate with satellites…
There’s not exactly a ton of geospatial data or maps for the polar regions, especially Antarctica.
Where it gets really interesting is how we can apply our archive of satellite imagery to help researchers solve problems or come up with cutting-edge solutions with the data. One example is the ArcticDEM project. In a private-public collaboration, PGC is using high performance computing (HPC) to develop a pan-Arctic Digital Elevation Model (DEM) at a resolution 10 times better than what exists now. This project requires hundreds of thousands of stereoscopic satellite imagery pairs to be processed using photogrammetry techniques to build a three-dimensional model of the surface for the entire Arctic. There are countless more applications for the imagery and we’ll continue to push the limits of the technology to produce innovative products to help measure the Earth and solve really important research questions.
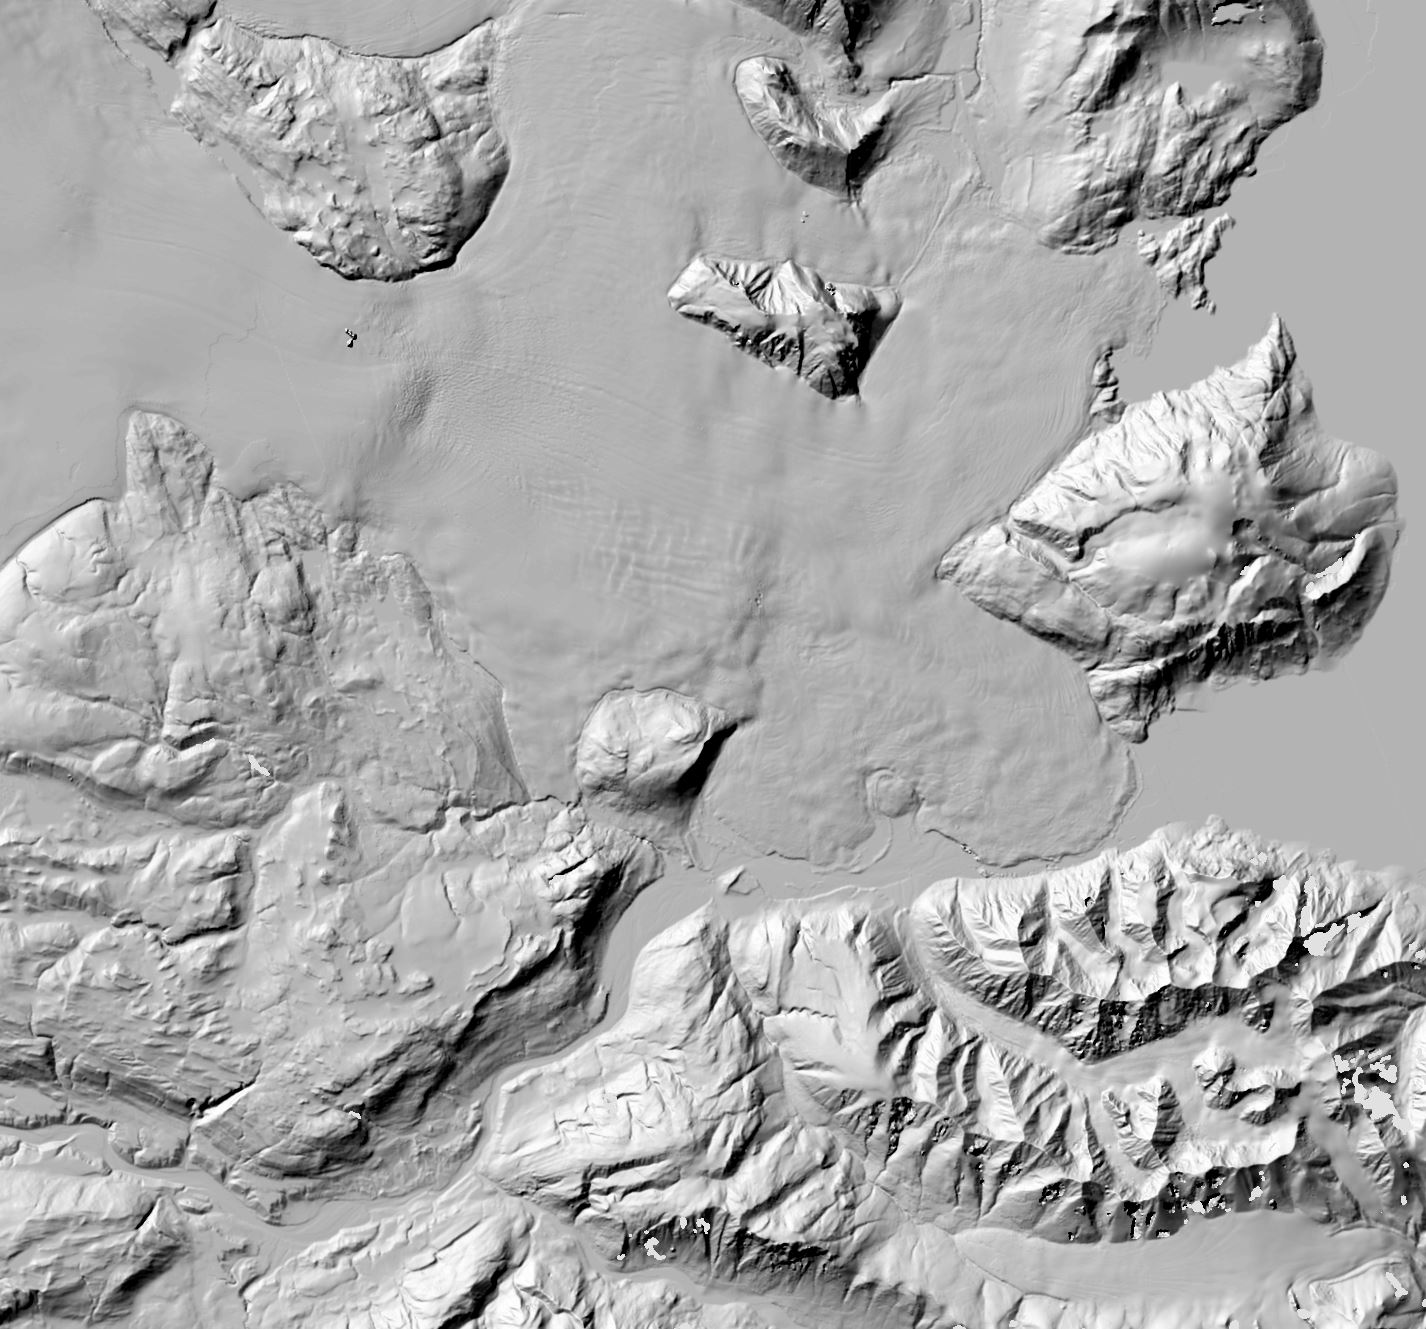
ArcticDEM hillshade in East Greenland. DEM(s) created by the Polar Geospatial Center from DigitalGlobe, Inc. imagery. [Credit: Brad Herried/ Polar Geospatial Center].
What resources can cryosphere researchers and other polar scientists without US funding get from PGC to enhance their research?
Our website provides a wealth of non-licensed data, freely available to download. That includes our polar map catalog (with over 2,000 historic maps of the polar regions), aerial photography, and elevation data. The ArcticDEM project I mentioned before is freely available (see https://www.pgc.umn.edu/data/arcticdem/), as are all DEMs created (derived) from the optical imagery. Moreover, we work with the international community on a regular basis to continue mapping efforts across both poles.
What advice do you have for students interested in a career in science or geospatial science?
This might be a little bit of a tangent, but learn to code. I was trained in cartography ten years ago and we hardly touched the command line. Now? You certainly don’t have to be an expert, say, Python programmer, but you’re behind if you don’t know how to automate some of your tasks, data processing, analysis, or other routine workflows. It allows you to focus on the things you’re actually an expert in (and, employers are most certainly looking for these skills).
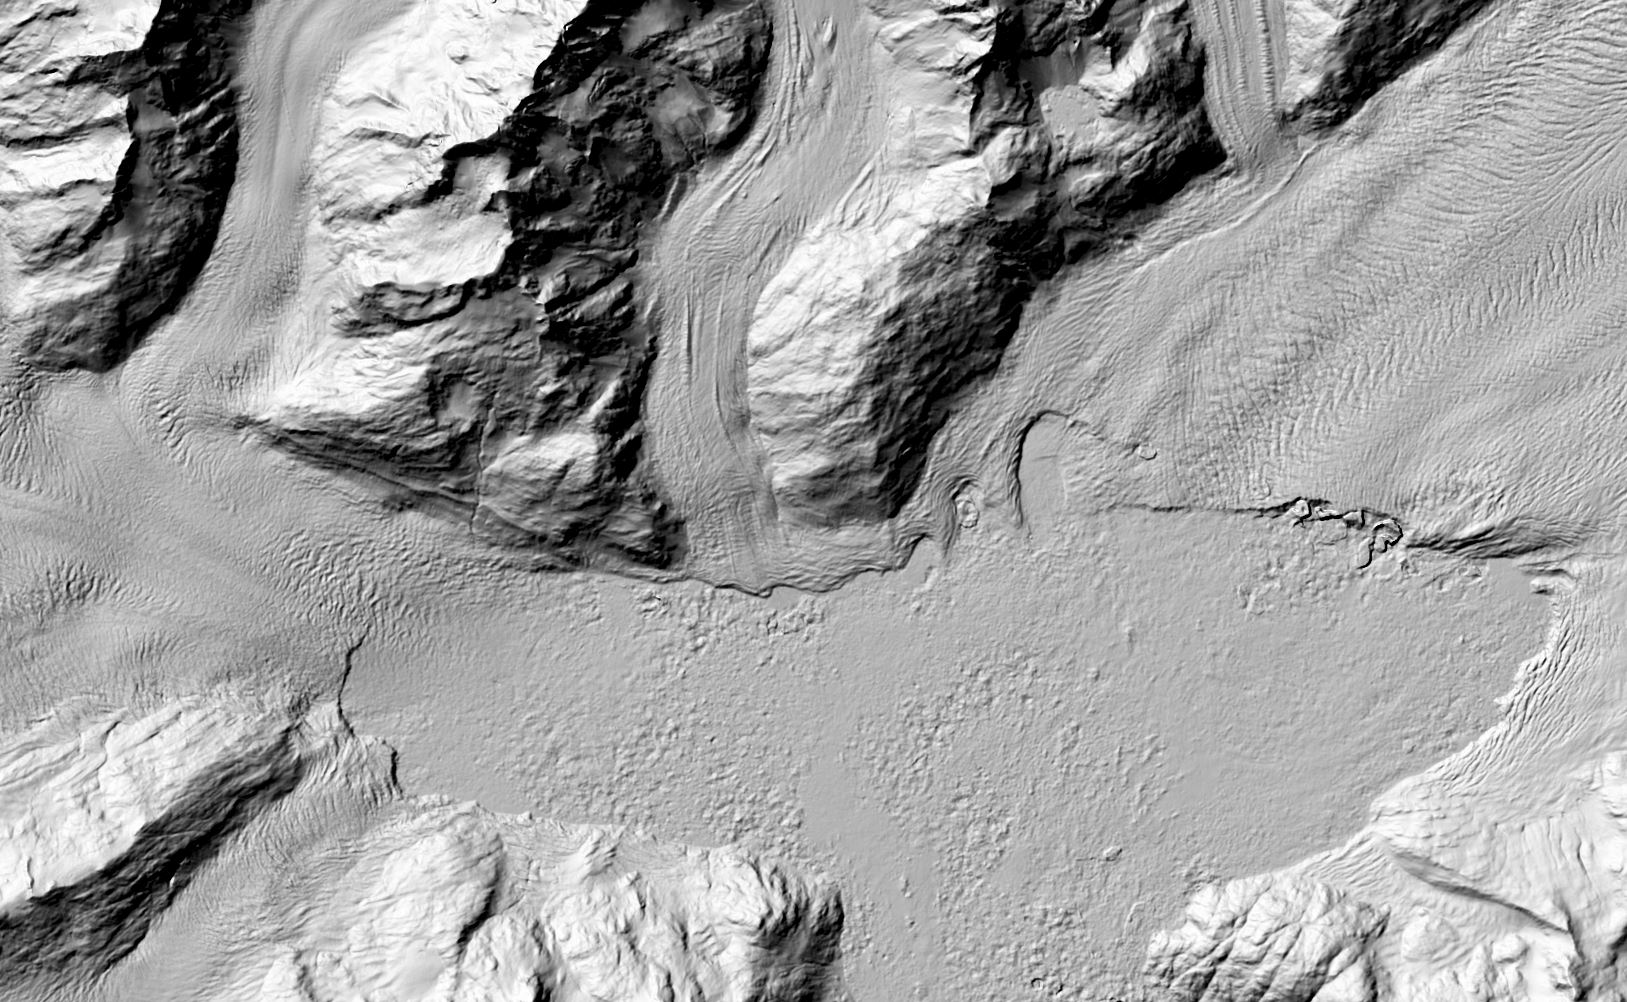
ArcticDEM hillshade of Columbia Glacier, Alaska. DEM(s) created by the Polar Geospatial Center from DigitalGlobe, Inc. imagery. [Credit: Brad Herried/ Polar Geospatial Center].
Personally, what has been the highlight of your time at PGC so far?
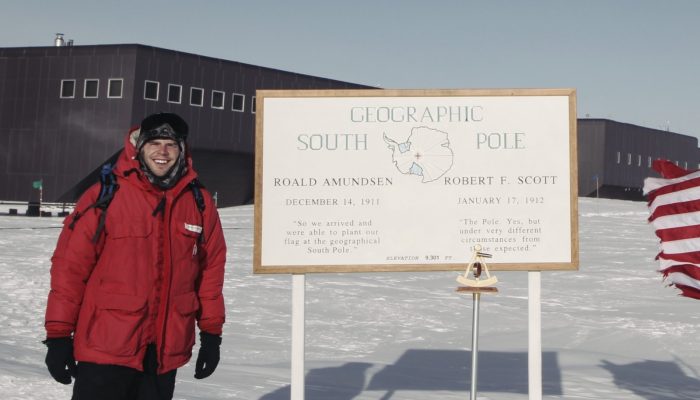
I will never forget the first time I stepped off the plane landing in Antarctica as a graduate student. A surreal, breathtaking (literally), and completely foreign feeling. To be able to experience the most remote places on Earth first-hand naturally leads to a better understanding of them. So, the highlight for me is this: I find myself asking more questions, talking to the preeminent researchers and students about their work, and discovering the purpose of it all. I may be a small piece in the puzzle of understanding our Earth’s poles, but I’m humbled to be a part.
Interview and Editing by George Roth, Additional Editing by Sophie Berger
James Harden
thank you